Council margin – LNP 14.2%
Mayoral margin – LNP 17.3%
Incumbent councillor
Andrew Wines, since 2008.
Geography
Northern Brisbane. Enoggera covers Gaythorne, Mitchelton, Newmarket, Wilston and parts of Ashgrove and Windsor.
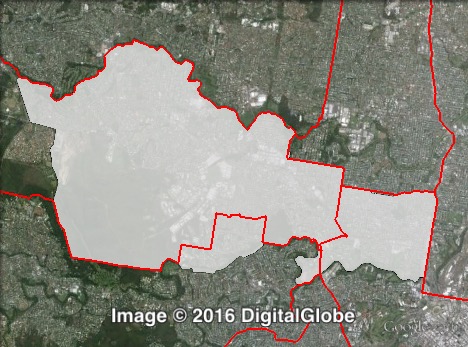
Redistribution
Enoggera shifted east, towards the Brisbane city centre, gaining Wilston from Central ward, and losing Ferny Grove and Upper Kedron to The Gap.These changes cut the LNP council margin from 15.6% to 14.2%, and the mayoral margin from 17.4% to 17.3%.
History
Labor’s Ann Bennison won Enoggera ward in 1994, winning re-election in 1997, 2000 and 2004.
In 2008, Bennison retired, with Labor defending a 9.2% margin. A 10% swing saw Liberal candidate Andrew Wines narrowly elected, and in 2012 he was re-elected with a 14.7% swing.
Candidates
- Andrew Wines (Liberal National)
- Amanda Ronan-Hearn (Labor)
- Kirsty Ksiazek (Greens)
Assessment
The Liberal Party’s narrow victory in Enoggera in 2008 helped give them a majority for the first time since the 1980s. If the 2012 swing was reversed, Labor could win Enoggera – if there is a uniform swing, winning Enoggera would give Labor half of the council seats.
2012 council result
| Candidate | Party | Votes | % | Swing | Redist |
| Andrew Wines | Liberal National | 12,336 | 58.6 | +12.3 | 57.2 |
| Matt Siggins | Labor | 5,727 | 27.2 | -15.1 | 27.9 |
| Wally Guthrie | Greens | 2,336 | 11.1 | -0.4 | 12.7 |
| Paul Hudson | Independent | 670 | 3.2 | +3.2 | 2.3 |
| Informal | 429 | 2.0 |
2012 council two-party-preferred result
| Candidate | Party | Votes | % | Swing | Redist |
| Andrew Wines | Liberal National | 12,624 | 65.6 | +14.7 | 64.2 |
| Matt Siggins | Labor | 6,636 | 34.5 | -14.7 | 35.8 |
| Exhausted | 1,585 |
2012 mayoral result
| Candidate | Party | Votes | % | Swing | Redist |
| Graham Quirk | Liberal National | 12,724 | 60.3 | +3.8 | 59.6 |
| Ray Smith | Labor | 5,453 | 25.9 | -6.4 | 25.2 |
| Andrew Bartlett | Greens | 2,442 | 11.6 | +2.8 | 13.1 |
| Rory Killen | Independent | 284 | 1.4 | +1.4 | 1.3 |
| Chris Carson | Independent | 190 | 0.9 | +0.9 | 0.9 |
| Informal | 400 | 1.9 |
2012 mayoral two-party-preferred result
| Candidate | Party | Votes | % | Swing | Redist |
| Graham Quirk | Liberal National | 13,032 | 67.4 | +5.0 | 67.3 |
| Ray Smith | Labor | 6,303 | 32.6 | -5.0 | 32.7 |
| Exhausted | 1,758 |
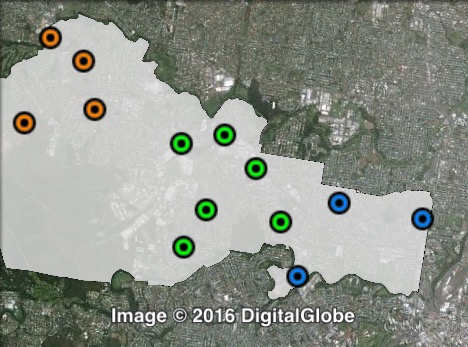
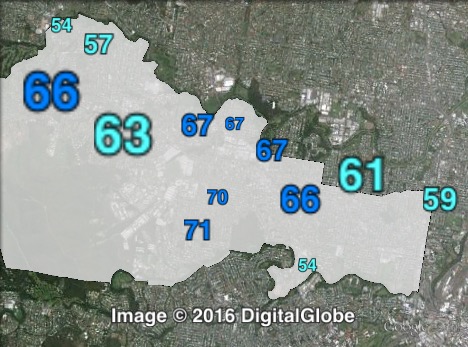
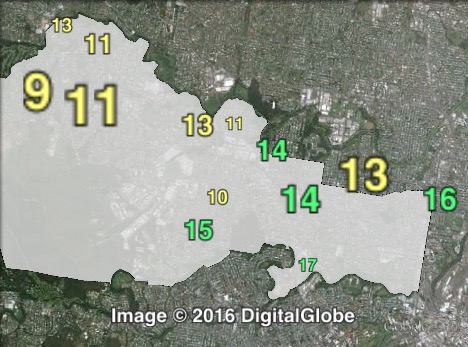
Booth breakdown
Booths in Enoggera have been split into central, east and west.
The LNP’s council majority was largest in the centre of the ward (67.9%), with the majority in the west at 61.5% and the lowest majority being 59.6% in the east.
| Voter group | GRN council primary | LNP council 2PP | Total votes | % of votes |
| Central | 13.0 | 67.9 | 6,550 | 28.4 |
| West | 10.4 | 61.5 | 6,155 | 26.7 |
| East | 14.4 | 59.6 | 3,592 | 15.6 |
| Other votes | 13.4 | 65.6 | 6,764 | 29.3 |