
The two-party-preferred count was effectively finalised last night, with the final figures counted from Cooper and Melbourne in inner-city Melbourne. There were 26 electorates where the final two-candidate-preferred count was not between Labor and the Coalition (non-classic), so a separate count was needed to produce a two-party-preferred figure.
It’s worth noting that there are 461 votes missing from the Kingscote PPVC (pre-poll voting centre) in Mayo, but every other result around the country has a primary vote which perfectly matches the 2PP.
In this post I’m going to look at the two-party-preferred counts in the non-classic seats, as well as looking at two-party-preferred figures overall by state and by geographic classification.
The two-party-preferred is an interesting metric. It is a simple statistic that can be an elegant way to analyse trends, but it tends to flatten the diversity of our political system into a simple Labor vs Coalition head-to-head. It makes it easier to compare current electoral trends to the last century of Australian politics, including periods when almost everyone voted Labor or Coalition.
While I don’t agree that a major party that wins the two-party-preferred vote has a “mandate”, I also think the 2PP is useful for giving everyone a chance to answer the question “if you have to choose who should lead the government, who would you choose?”. It’s why I’m confident in saying, while I don’t think Australians have expressed a clear view about the desirability of a majority Labor government, they have clearly expressed a preference for a Labor-led government over a Coalition-led government.
Labor won 77 seats, with the Coalition winning 58, and the crossbench includes sixteen seats.
Of those 16 crossbench seats, Labor won the two-party-preferred in seven seats, with the Coalition winning the other nine. Labor won the 2PP in the four Greens seats, as well as the inner Hobart seat of Clark, as well as the south-western Sydney seat of Fowler and the Centre Alliance seat of Mayo.
Clark, Fowler and Melbourne are no surprise. Mayo is an interesting result, for a seat once considered heartland for the Liberal Party. The Greens 2CP and Labor 2PP in the three inner Brisbane Greens seats are very similar, with Labor doing better after preferences in Brisbane and Griffith, and the Greens doing better in Ryan.
The Coalition still won the 2PP in the seven urban teal seats and Indi. I was a bit surprised that Labor didn’t come out on top in any of these seats, in particular the swing in Kooyong was just 2.2%. There was a large 2PP swing to Labor in Bradfield, where an independent did surprisingly well while falling short, but much smaller in seats like Mackellar.
This map shows the two-party-preferred result per seat, and can be toggled to show the swing.
If you look at the four biggest urban centres, you see different trends in terms of 2PP swings. The swings to Labor are huge in Perth. In Brisbane, there are swings to Labor everywhere, but quite small in outer Brisbane, and larger in inner areas. In Melbourne, by contrast, a lot of outer suburban seats swung to the Liberal Party. The Liberal Party even gained a swing in Cooper, which was already one of the safest Labor seats in terms of 2PP.
In Sydney, Fowler stands out on its own. There was an 8.3% swing to the Liberal Party, which technically would have made it marginal in the absence of newly elected independent Dai Le. This is consistent with the theory that Le may have picked up extra voters who wouldn’t have voted Liberal, but she also harnessed a general anti-Labor swing triggered by Kristina Keneally’s parachuting.
Zooming out, we can now also look at two-party-preferred trends more broadly. I wrote a blog post in the week before the election looking at how much each state varies from the national results over time, and I’ve updated that graph below to include 2022.
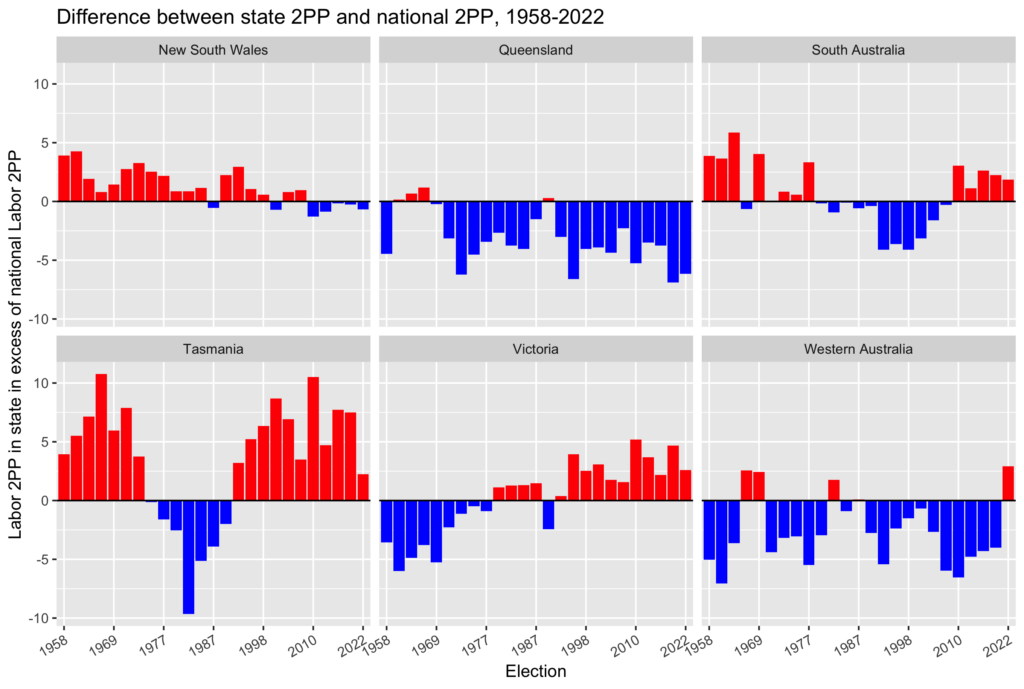
All but one state has moved closer to the national result in 2022, with Western Australia flipping and producing it’s strongest Labor result relative to national results during the timeframe covered by this chart. New South Wales is the one exception, but it is still very close to the national result.
Finally, this next chart shows the same information but divides up seats into the AEC’s four geographic classifications.
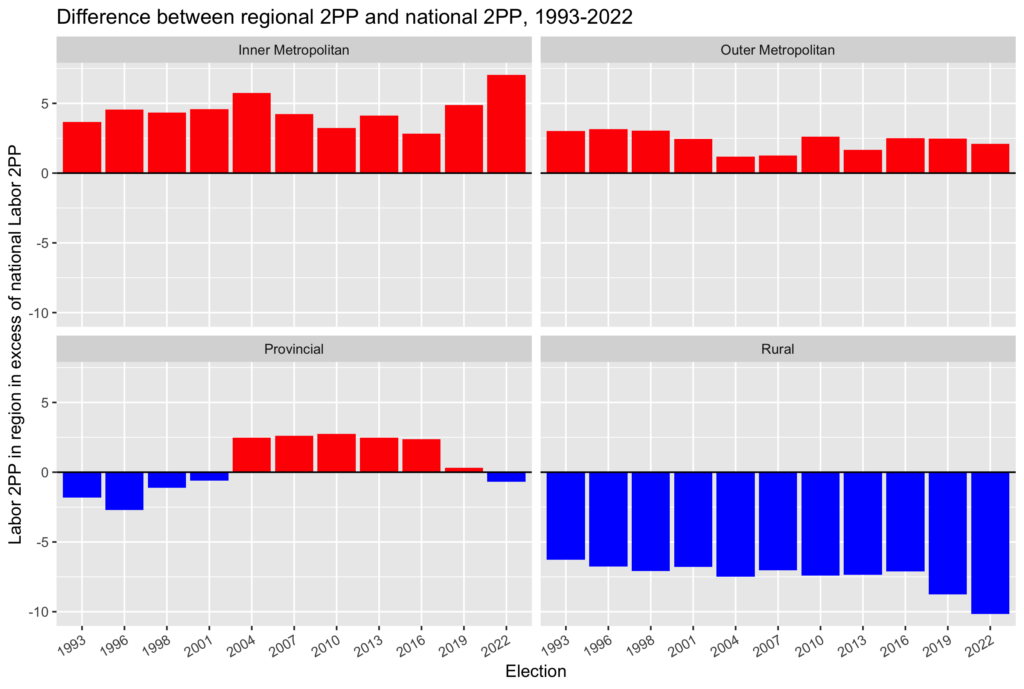
Inner metropolitan Australia has never had such a strong Labor lead, with a Labor 2PP of 59.17%, more than 7% above the national result. Rural Australia has the opposite trend, with a Coalition 2PP 10.16% better than the national result.

Thanks Ben – the trend views are excellent. Both long and short term.
North Sydney had a big swing (>8%) which may get bigger if there is an error in one of the PPVC’s. And if so, will just fall short of Labor 50% on 2PP.
Goldstein and Kooyong are surprising – both on 6% margins pre election but only 2% TPP swings even with the potential of IND vote leakage – whereas Higgins was 4.7%, though even this was below the 6-8% swings seen in some similar seats in Sydney. The seems to have been underlying softness for Labor in Victoria relative to 2019.
I can’t get the map to show yet, but notably I think everything from Sydney CBD clockwise through the inner west, north west (inner and outer) and north, all the way around to Mackellar, swung heavily (6 – 10%) to Labor – even Mitchell and Berowra.
Thanks Ben, the macro trends showing up for the AEC’s 4 geographic categories are particularly informative.
At the risk of beating a well-worn drum, I hypothesis that these macro trends subsume a growing divergence between the Lib and Nat parties ( or at least their core constituencies). I guess that that the summaries for the 2 metropolitan categories are basically ALP vs Lib 2PPs, while the Provincial is a mix of Lib+Nat vs ALP 2PP and the Rural is mostly ALP vs Nat. The overall trends for these geographic categories would broadly fit with the ABC’s data (90% vote counted) that changes in party primary votes were: ALP -0.8%, Lib -4.3% and Nat/LNP -0.7%. If this interpretation is right, it’s the Libs who are in most trouble, not only with primary votes but also with 2PPs, although that’s hidden inside summary 2PP data that combine Lib and Nat constituencies within ‘the Coalition’.
I just love:
It’s worth noting that there are 461 votes missing from the Kingscote PPVC (pre-poll voting centre) in Mayo, but every other result around the country has a primary vote which perfectly matches the 2PP.
And Kevin Bonham / William Bowe picking up the error in Gilmore at the Gerringong booth.
Bit hard to see how an election could be stolen in Australia. May be the US could learn something about how to run elections from Australia…..
Best,
Pollster
Very useful data Ben. I find your final graph relating to geographic categories most interesting of all.
I’m still curious as to why Labor didn’t do better in outer metro areas & ‘provincials’ more broadly. I’ll stick with Qld because that’s what I know best, but pre-election the most marginal LNP seat was Longman (centred around Caboolture, which I think is still fair to describe as working class, as well as retiree/canal estate areas like Bribie Island & places that could be described small regional towns & farmland still close to metro areas). There was almost no swing to Labor there, which seems odd given it’s lower socioeconomic situation & there rightly being so much focus on cost of living issues.
The swings against the Libs in inner Brisbane were very big – around 10%. Even bigger than what the polls suggested might happen in Qld in 2019 but obviously didn’t, & also bigger than what the polls suggested might happen in Qld in this time and obviously did.
There are enormous cost of living issues in inner Brisbane as well of course, and just because the mean average level of wealth is higher than outer Brisbane doesn’t mean there aren’t a huge number of people doing it very tough right now.
But it does still raise the issue of why areas that are in general poorer swung less to Labor (& the Greens) (on average) when cost of living or even general stuff about corrupt govt or climate change were issues, rather than manufactured culture war issues like asylum seekers or 9/11. (Not that I necessarily agree with arguments that low socio-economic areas are more susceptible to culture war crap, but other than Morrison’s execrable pre-meditated fear campaign about trans people & his obvious own goal of the cosplay beating of the ‘drums of war’ about China, the culture war crap wasn’t even present as an issue (except as a negative for the Libs).
if we compare 2007 and 2022. It is clear that Labor underperformed in Queensland especially outer Brisbane and Regional QLD. For example they did not win Flynn, Capricornia, Forde, Petrie, Bonner and Longman which they did in 2007. The also underperformed in the 3 Tasmanian seats of Bass, Braddon and Lyons. However, there are some rural/provincial seats which Labor overperformed compared to 2007 those being Eden-Monaro, Macquarie, Corangamite, Gilmore, Bendigo, Ballarat, Monash/McMillan. These also failed in Lindsay and Page which were good results in 2007. Interestingly, Labor actually overperformed in McEwen compared to 2007 although i concede this should be expected due to growth of Melbourne’s northern suburbs.
Nimalan, I think the McEwen comparison is probably not accurate, unless you are going off the booth figures. McEwen in 2007 covered a lot more rural areas compared to the current district which is now almost entirely outer suburban areas.
@ Yoh An, i am going on the Ben’s calculation on the green dotted line on the McEwen thread that Adjusted to current boundaries Labor would have got 50.5% in 2007 while on the original boundaries Labor actually lost by 14 votes i believe. While it did have more rural areas it also contained Strongly Labor voting Warburton now in Casey and places like Wallan, Mernda etc were not as strong for Labor back then as it was more semirural.
@Andrew Bartlett interesting query “Why did Labor not perform so well in outer metro & provincial Australia”. I made some similar commentary regarding this on Ben’s breakdown of the Inner City Brisbane results but would like to expand it to incorporate your specific question as an example.
I believe that your assumption that poorer or working people should gravitate towards Labor (or a similar social democracy party) is based on an antiquated 20th century distinction of the fault lines between the two major poles in politics; not just in the Australian context, but across Western democracies. The old fault-line which I am referring to is the “working people” on the side of centre-left social-democracy (Labor) and the rich aristocracy on the side of the liberal conservatives (Liberals & Nationals).
There have been multiple factors which broken down this fault line and have had others redrawn. ie. young vs old, working vs retired, uni-educated vs never finished high-school, works in an office vs on site. One of the first things I’d point out is that distinctions like “working class” is an increasingly vague and less important distinction. Although different forms of employment and their associated sectors tend to be a strong indicator or certain political attitudes. For much of the 20th century when unions were widespread, working people were reliably delivering votes to the Labor Party. But for a lot of factors which I think I did a good job of explaining here https://www.tallyroom.com.au/47900 this has fallen apart at the turn of the century.
A related general comment that I’d also make is that Australians are generally non class-conscious when compared to other cultures in the World, they just do not strongly identify with class tribalism. Although this does not mean that class tribalism aren’t expressed via other implicit proxies like “Rugby League vs Union”.
I think the ANU’s 2022 Federal Election Study provides some insight to your question too. The study derived Age and Education as the strongest indicators of a person’s first-preference vote rather than Income. This insight does provide some context to Longman. You rightly mentioned the aged retiree population throughout the division particularly in places like Bribie. The division of Wide Bay is very similar. It is clear that there wasn’t a significant swing towards Labor even despite cost-of-living pressures because this older population still identifies and trusts the LNP more than the Labor party. Even if they might have at one point been a working person consistently delivering votes to Labor. The current retired population are overwhelmingly from the “baby boomer” generation. This particular cohort are sympathetic to the Coalition due to their retirement policies as well as their historical tax policies that benefited the baby boomers.
@Nimalam, I don’t think its very accurate to use 2007 as a benchmark for Labor’s performance in Queensland. In fact I consider 2007 a huge outlier due to Kevin Rudd. Queenslanders have a notable state tribalism and enthusiastically rallied behind the prospect of a potential Queensland Prime Minister: Kevin Rudd.
The divisions you mentioned: Flynn, Capricornia, Forde, Petrie, Bonner & Longman are amongst some of the least politically engaged divisions in the Queensland. Divisions which would be unsurprisingly be energised to vote for parochial reasons like “Kevin Rudd is a Queenslander!”. Worth noting that Premier Palaczuk’s success is in part due to her ability to channel this parochial tribalism. I also think its possible that Federal Labor can harness this energy in Queensland if they ever selected Jim Chalmers to take over the leadership from Albanese. Unlikely given what Albanese has pulled off and the honeymoon period with the public that he currently enjoys. Regardless, the character of Albanese was a step in the right direction for what would be considered appealing to Queenslanders anyway.
Interestingly I think that the Greens attempt to channel this mystical Queensland spirit for their campaigning up here in the most recent election. I also think it helped to improve their perception from Melbourne latte-sippers, to “GREENSLANDERS!”
@ SEQ Observer, i used 2007 as the benchmark as it was the most recent occasion when Labor gained government from Opposition. i do agree about the parochial nature of Queensland and maybe other states that have not produced many Prime Ministers unlike say Vic or NSW. i used Forde and Petrie in particular to highlight the fact that these are often bellweather electorates. Forde is very mortgage belt. Flynn and Capricornia were used as they show the weakness in Regional QLD. It used to be the case Capricornia was often only held briefly by the Coalition. It is the first time in over 100 years that Labor is in government without holding Capricornia. Longman is interesting as it the poorest Coalition held Urban seat and Bonner was the most marginal seat in QLD going into the 2007 election, it was notionally Labor when created in 2014. Keen to know if you think Labor could win any of those in 2025
I think there were a couple of reasons Labor didn’t perform as well in Queensland in 2022 as they did 2007. One is definitely the Kevin Rudd factor. Another is there wasn’t a strong Green presence in 2007 like there was in 2022, without the Greens Labor likely hold Griffith and gain Brisbane and Ryan. Another reason is the margins they were trying to overcome due to the last election. Abnormal margins usually take more than one election to correct and we’ll see this at the upcoming Vic election. When a seat with a 2% margin turns into a 14% margin it doesn’t go back to 2% the net election, it gradually goes back, maybe turning into an 8% margin and so on. Labor didn’t win Dawson, Flynn, Capricornia, Bonner, Forde or Petrie because they were all on safe margins due to the swings Libs got to them last election. The difference between Vic Libs and federal Labor though is that Vic Libs probably won’t win government next election so if they turn some seats that are usually marginal but became safe seats since last election marginal again they can target them next election whereas the ALP are now in power and these seats may not vote for an incumbent ALP, although maybe if it’s led by Jim Chalmers but it’s very likely Albo will lead Labor to the next election.
I believe Dawson, Capricornia and Flynn are also mining seats mixed with rural and regional cities so climate change policy and attitude to coal mining are probably important to these seats.
Palaszczuk is successful probably because like you said leans into the parochial tribalism is that the QLD LNP suck and state politics is more localised, for QLD ALP it doesn’t matter what inner city progressive seat in Melbourne think, hence the support for coal mines.
Agree with your first comment seq observer, I found Australia now is like the USA where those who are considered working class do not automatically vote for left leaning parties but are in fact trending conservative as industries are no longer heavily unionised and the fact that there is the rapid decline of manufacturing and resource sectors.
The reason that Palaszczuk was able to win elections has to come down to these factors:
– Palaszczuk was able to reconcile policies on voters from mining towns to inner-city suburbs and social conservative to social progressive
– Palaszczuk is pro-coal with her campaigns directing coal miners
– QLD LNP seems to have ineffective leaders, looking that they only did not govern Queensland in all but 5 of the last 33 years. Campbell Newman (although now an LDP) is a textbook case on the association of QLD-based LNP
I believe this is only applicable for QLD as QLD Labor tends to be controlled by the Right Faction (as a result of the states conservatvism) compared to other states and federally so there isn’t so much division in the party however this ironically did some harm in the federal election by losing their seats to The Greens in Brisbane
It looks like Albo performed better in the capital cities than Kevin ’07 did at least in 2PP terms and even in seat numbers. You may already know that this is the Liberal Party’s seat count is now at the lowest, compared to the total seats up for grabs, since the 1940s when it was founded. Fun fact: WA was the most pro-Labor state at this election. It’s 2PP was the highest here.
Ignoring QLD and WA, which are outliers, Labor really went backwards in rural Coalition-held seats but managed to hang on to Gilmore and get swings in Macquarie and Eden-Monaro. The rural swings in QLD were realignment swings after what had happened in 2019, especially in Capricornia and Flynn. Most of Labor’s seats appear to be concentrated in capital cities, more so than during Kevin Rudd was around but it may be partly because metropolitan areas actually grow faster than rural areas.
A generation ago, you could assume that wealthy, tertiary-educated electorates would vote for the coalition whilst low-income electorates would vote for Labor. Many inner-city areas have gentrified and the median incomes and property prices have shot up but the Coalition didn’t gain many, if any, inner city seats. These days, a better predictor would be median age. The electorates in QLD on the Gold Coast, Sunshine Coast and Wide Bay have an older-than-median population and are most likely, attracted to their retiree policies as well as religious interests and social conservatism.
@Nimalam I’ll give my assessment of Flynn, Capricornia, Forde, Petrie, Bonner & Longman for the 2025 election. Some of the factors I mention might come to a head in the 2024 Queensland State Election rather than 2025, making the aftermath of the State Election a big unknown that will likely affect 2025.
Flynn:
Flynn is largely driven by the industrial hub of Gladstone and its base of unionised workers and young engineers. I’ve mentioned previously that this is an evapourating constituency in Australia but Gladstone’s industrial strength bucks this trend. With my assessment of Flynn, I am assuming that Labor continue its attempt to walk this tight rope between progressive, urban electors and its declining provincial “blue-collar” base. Severing this cord to the latter will likely put Flynn in safe LNP status for the short-medium term. I doubt this will be the case given the terrible implications for Queensland state Labor.
I think that Flynn is possible for Labor to Gain if its energy and resources sector both manages to stay afloat and at the same time be positively reformed and transitioned over the next three years. If there is turbulence in this transition, then I think that it will be escalated by the Opposition. If the turbulence turns into deep issues and the industries falter, this workforce will diminish in numbers and in their disaffection they will turn back to ONP. The Callide By-Election showed that ONP and KAP are still a live force in this region. I also think that the Callide By-election showed that Labor should be careful trying to stoke its own culture war issues or bite into the Opposition’s. I saw some sentiment that while the Biloela family was celebrated more broadly in national news, that locals were not as chuffed. Outside of this, Labor’s insistence of staying on message, sticking to cost-of-living and the Coalition’s incompetence while not straying to far into culture-war territory probably was of benefit to them in Flynn but more broadly across the other divisions I will mention. I wanted to point out before moving on that the ABC Vote Compass’ Results by division is quite informative on how “socially-conservative” some Queensland divisions are.
Capricornia:
I do not think that Capricornia will again trend significantly in the direction of Labor in the short-medium term and will remain an LNP seat following the ongoing long-term trend in Queensland.
You rightly mentioned that throughout much of the 20th century, Capricornia remained in the hands of Labor. Throughout the 20th century it had a similar industrial base to Flynn but has always been more agriculture centered. The Agriculture sector was one that did see a decline in workers due to emerging agricultural technology and a great loss of unionisation. This made the constituents especially sympathetic to the LNP.
Another thing I would mention is the presence of a Defence industry in Capricornia this also makes Capricornia sympathetic to the Coalition and their strong posture on defence issues.
Rockhampton in its transformation into a modestly-sized city has also established a service-based economy independent of its industrial base. Today Capricornia is similar in profile to divisions like New England and Page. Both New England and Page are agricultural districts with large-towns and have proven to be safe Nationals territory.
Forde:
I do not think that Forde will be a Labor gain at the 2025 election but it might be at subsequent elections due to ongoing population change and employment composition but also redistributions. I always like to mention that in 2016 it was described in a study as the least politically engaged division in the country.
You rightly mentioned that Forde overlaps the mortgage-belt of the outer suburban growth areas of the Gold Coast’s North and Brisbane’s South-Western corridor. This will make the division vulnerable to cost-of-living pressures relating to interest-rates if they continue to escalate. The composition of further population-change will define whether this area trends in the direction of Labor or LNP. This is the profile of division that the Opposition have their eyes on right now as a model of their new base. They would be looking to find how their strengths in a division like this could be applied to outer-suburban mortgage-belts throughout Sydney and Melbourne. They would also be directing their opposition strategy around the concerns of communities like this.
Once the extension of the Logan Hospital extension is complete and the Coomera Hospital is constructed, I expect that Forde will become slightly more favourable towards Labor because of the increase in health-workers in the division. This will make the division more attuned to health policy on which Labor is considered strong. However, this will have more impact on state politics and has a longer timeline than 2025. I would also argue that health is already a significant sector in the employment composition of the division.
Regardless of my points, this particular area is vulnerable to redistributions. The growth corridors on the outer suburban fringes of Brisbane, bleeding into the Gold Coast, Sunshine Coast, Ipswich, Lockyer Valley and Scenic Rim are each likely to be touched in some way. The North-South divide in Forde between Logan LGA and Gold Coast LGA also divides where Labor is strong and LNP are strong. Logan LGA is Safe Labor territory of which Jim Chalmers is a key figure. Whereas the Gold Coast LGA has established itself as safe LNP territory. Forde has recently been marginal and also somewhat of a bellwether, because it holds an equilibrium of people between these two communities. Strong population growth on the Gold Coast’s North (amongst the highest in the state), has helped Forde trend in the direction of LNP in last ten years. If Forde loses a significant chunk of its Gold Coast area, it will become target Labor. If Forde drifts southwards to encompass more of the Gold Coast it will strengthen its status as safe LNP.
A final note I’ll make about Forde is that the primary vote of Labor was terminal in Forde: 28%. There is a lot of work Labor need to do to restore this primary vote through good governance over their term. LNP fell to 36.9% on primary votes, but most of this swing went onto benefit the microparties and independents.
Petrie:
I believe that Petrie will not be a gain at the 2025 State Election.
My assessment of Petrie is similar to my assessment of Forde in that it kind of operates as an equilibrium between two distinct LGAs: Moreton Bay Regional council and Brisbane City. With Redcliffe being an older population and a popular place for people to retire, it is generally more favourable to the LNP. North Lakes on the western edge of Petrie is a mortgage belt, similar in urban development and services to the outer-suburban growth corridor on the north side of the Gold Coast: leaning towards LNP. Whereas Bracken Ridge in the bottom edge behaves more like neighbouring Lilley, less retired age people, more working age people and young families that would work in Brisbane, favouring Labor. Because this electorate overwhelmingly encompasses Redcliffe and North Lakes, I think this will be a tough prospect for Labor in 2025.
There is also a Peter Dutton factor at play here. Now that the leader of the Opposition effectively represents this Moreton Bay region via neighbouring Dickson, you can expect his leadership to at least sandbag but perhaps also strengthen the LNPs vote in Petrie, Dickson and maybe even Longman. (Assuming Dutton isn’t disgraced during his term).
Longman:
My assesment of Longman is quite similar to my assessment of Petrie however I think it is more favourable to Labor. Important to note that Longman is more vulnerable to cost of living pressures than Petrie. Caboolture in particular is a poor and uneducated community relative to the rest of South East Queensland. I would say that Labor’s key to winning Longman is how the cost-of-living crisis is dealt with and framed. Success with this issue will help to soften the skepticism that low-income punters have of the Labor brand throughout Queensland. However, any issues which the Opposition are able to escalate or re-frame poorly in relation to this crisis over the course of next few years will only deepen their skepticisms.
Like Forde, Longman is another outer-suburban marginal which the Coalition will be focusing on and modelling their Opposition around. So you can expect it to be an important battleground in 2025.
Bonner:
I think that Bonner might be a LNP loss in 2025 but not necessarily a Labor gain.
This is an interesting division within Brisbane because it ends up being a microcosm of diverse interests and attitudes.
Firstly, it overlaps with what is growing traction as Brisbane’s “bible-belt”. This is something which I have found religious people self-identify with in Wishart, Mount Gravatt, Mansfield and Carindale. Citipointe Church and College are of course found in this area. These constituents provide the LNP with an inherent religious-right base to work off in Bonner.
There are also big pockets of wealth in this division like in Burbank, Gumdale and Chandler: leafy-green acreage suburbs that Victorian observers would find similar to Kooyong. Places which would generally be favourable to the LNP provided a small l liberal candidate. This form of Coalition supporter is not as abundant in Queensland as Victoria.
And finally Bonner also encompasses a significant uni student population, housing much of Griffith University. The peripheries of this campus unsurprisingly delivered a strong Greens vote (25%+) and are in favour of Labor on TPP.
This competing mix of varying political attitudes is likely what has made Bonner a great Bellwether in the past. The pockets of acreage suburbs and identification with Christianity has buffered Bonner from being notionally Labor like the rest of Brisbane. Although a high-profile teal candidate who is appealing to both affluent and progressive voters would likely be more of a threat to the LNP here than Labor currently are. This seat’s status will come down to whether the teal tide will continue or recede in 2025. Moncrieff and McPherson on the Gold Coast are of a similar profile to Bonner and would also be worthwhile teal targets.
Comments are closed.