 So we finally have booth breakdowns of the Tasmanian election results – and for the first time these have been published as spreadsheets (rather than PDFs or image files) which made it much easier to analyse. And they have also finally published the list of booths in a format useful for analysis (rather than on the website in a format for voters) with a match between the unique booth name in the results table and the full address, which means I don’t have to guess which address matches which votes.
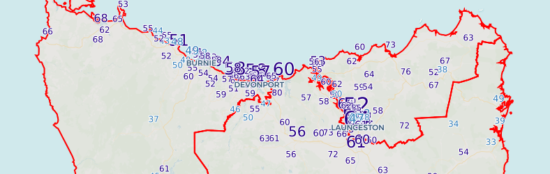
I’m about to dash off for the weekend but before I do I put together two quick maps. The first shows the primary vote totals for the three main parties by booth across the state. The second shows the swings to and from each party. You can toggle on each map between Liberal, Labor and Greens, with Liberal as the default. I’ve also included links to the maps if you want to view them full screen.
Firstly, here’s the primary vote totals. It’s particularly interesting to look at the shockingly low Greens vote in Braddon – the party is a long way away from winning back a seat here:
Secondly, here’s the swings. There were very few places where the Greens gained ground. While the Liberal Party suffered a small statewide swing, there were plenty of places where they gained ground.
That’s it for now – I’ll be back next week as we head to South Australia and Batman, and should expect to start publishing seat guides for the next big elections by April.

Sorry to be a nitpicker, but while your core point about the very low in Braddon is valid, I am pretty sure Christine Milne was first elected as a member for Lyons. (Where there was unfortunately also a fairly poor vote for the Greens this time – so you may also have meant to say Lyons rather Braddon).
Ah you are right! I was mistaken. Shouldn’t rely on my memory for facts like that.
Comments are closed.