Geography
North of Western Australia. Durack covers a majority of Western Australia’s landmass, stretching from the northern Wheatbelt outside of Perth, covering the coast all the way to the Northern Territory border. Major towns include Geraldton, Broome and Port Hedland.
2013 result
| Group | Party | Votes | Durack % | Statewide % |
| AA | Liberal | 26,622 | 34.32 | 39.20 |
| Z | Australian Labor Party | 17,122 | 22.07 | 26.59 |
| U | The Nationals | 13,426 | 17.31 | 5.07 |
| S | The Greens (WA) | 4,791 | 6.18 | 9.49 |
| F | Palmer United Party | 3,249 | 4.19 | 5.01 |
| B | Liberal Democrats | 2,652 | 3.42 | 3.43 |
| G | Shooters and Fishers | 1,802 | 2.32 | 1.04 |
| I | Sex Party | 1,225 | 1.58 | 1.49 |
| C | Australian Christians | 918 | 1.18 | 1.64 |
| D | Help End Marijuana Prohibition (HEMP) Party | 810 | 1.04 | 1.07 |
| Others | 4,949 | 6.38 | 5.98 |
The Liberal Party topped the poll in Durack, but with 4.9% less than the statewide average. The ALP and Greens also polled below their average, while the Nationals polled over 17%, compared to 5% across WA.
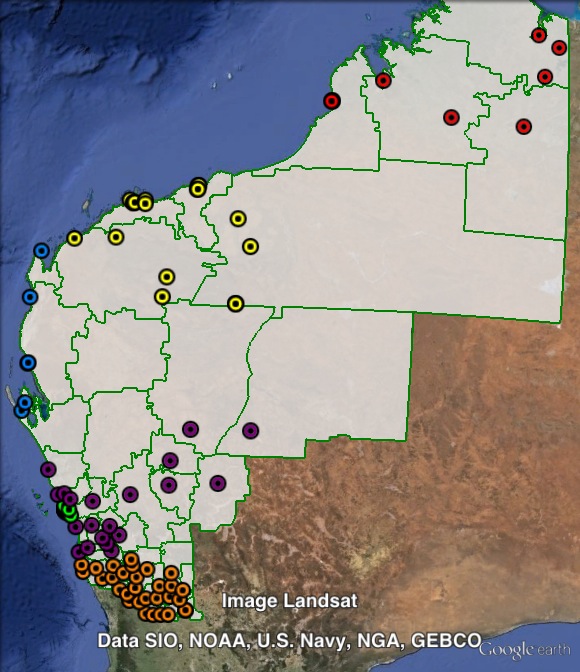
Booth breakdown
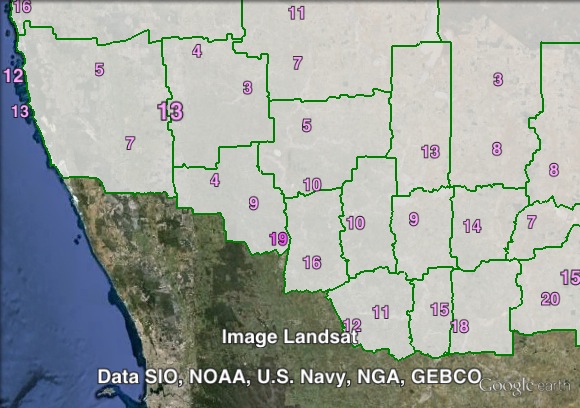
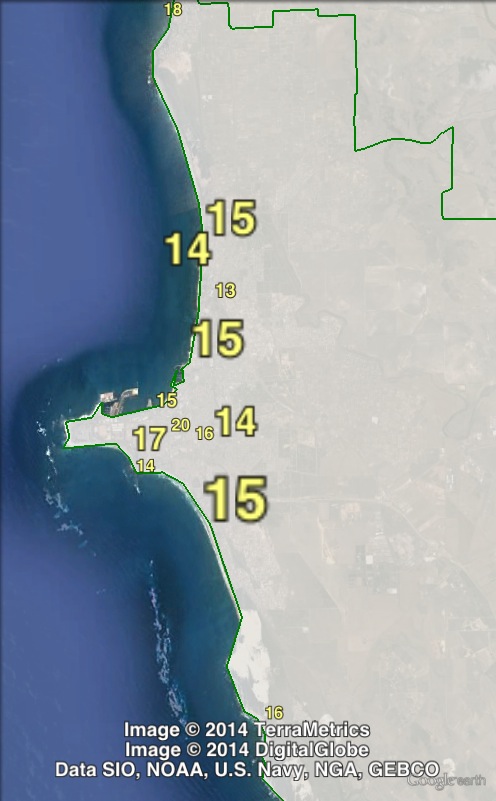
Booths have been divided into six areas. Those in the Geraldton urban area have been grouped together. The rest of the electorate was split into five areas. From north to south, these are Kimberley, Pilbara, Gascoyne, Mid West and Wheatbelt.
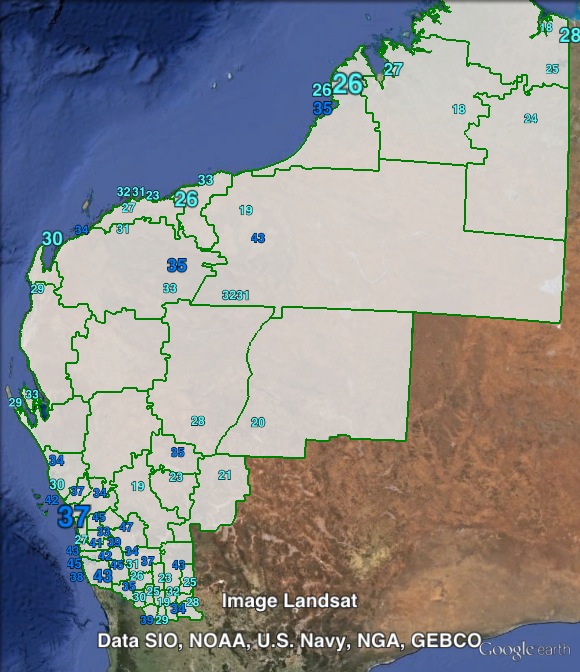
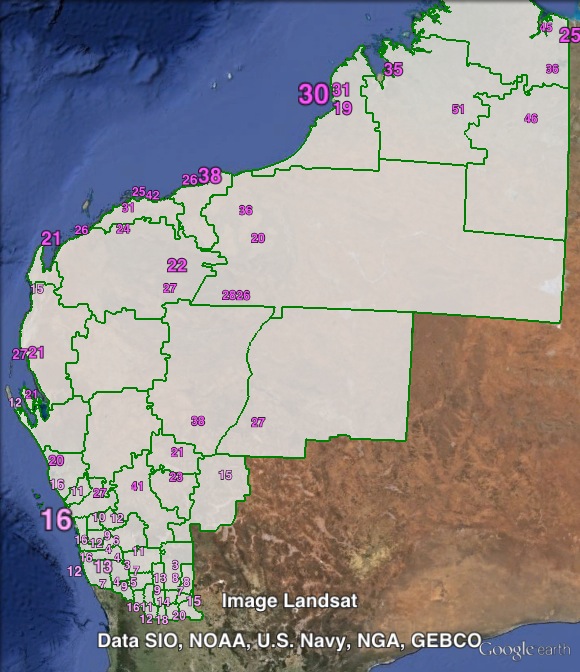
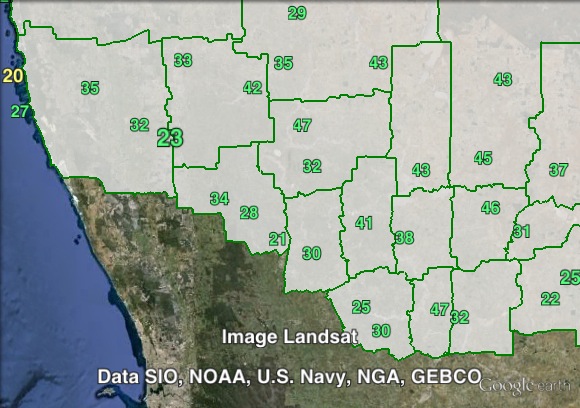
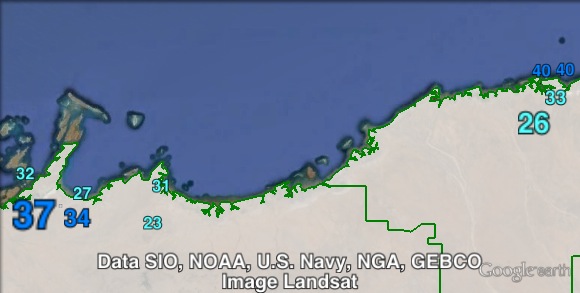
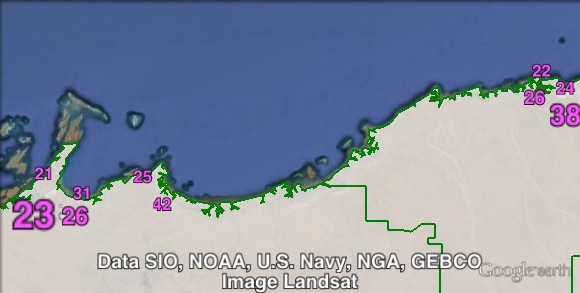
The Liberal Party topped the poll in five out of six areas. The ALP won 31% in Kimberley, outpolling the Liberal Party by 3.1%.
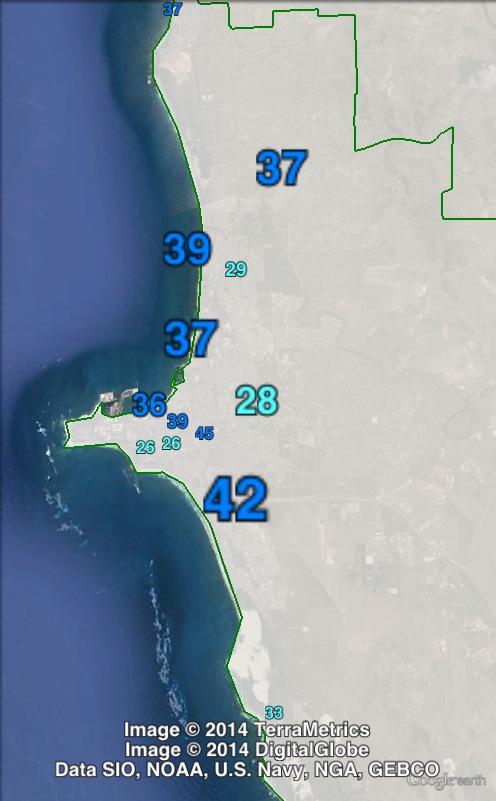
The Liberal vote ranged from 27% in the Kimberley to 37% in Geraldton. The ALP’s vote ranged from 12% in the Wheatbelt to 31% in the Kimberley.
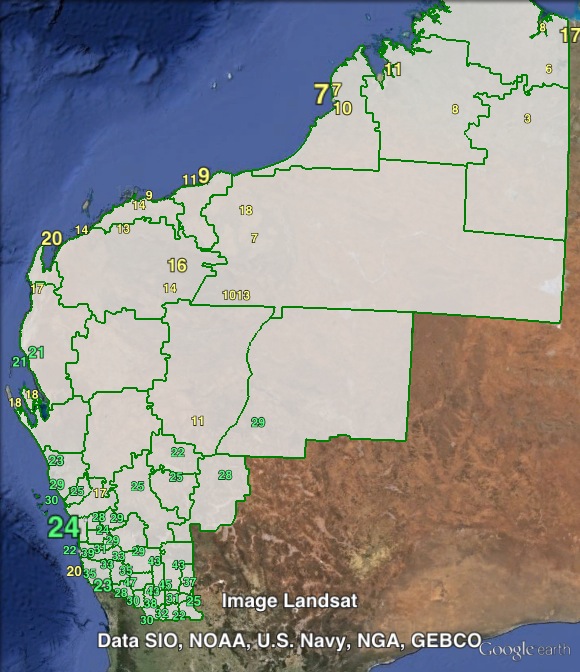
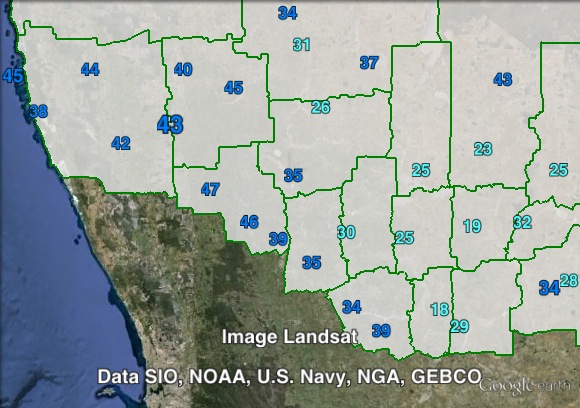
The Nationals came second in the Wheatbelt (30.4%) and the Mid West (25.3%).
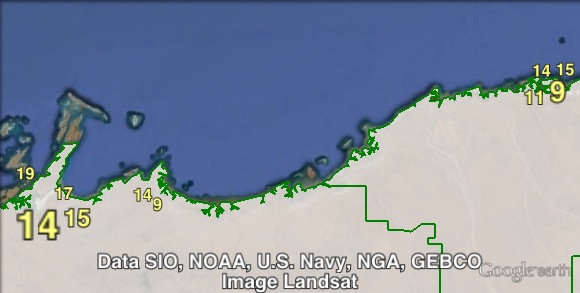
The Greens vote ranged from just over 3% in the Wheatbelt to 15% in the Kimberley.
| Voter group | LIB % | ALP % | NAT % | GRN % | Total votes | % of votes |
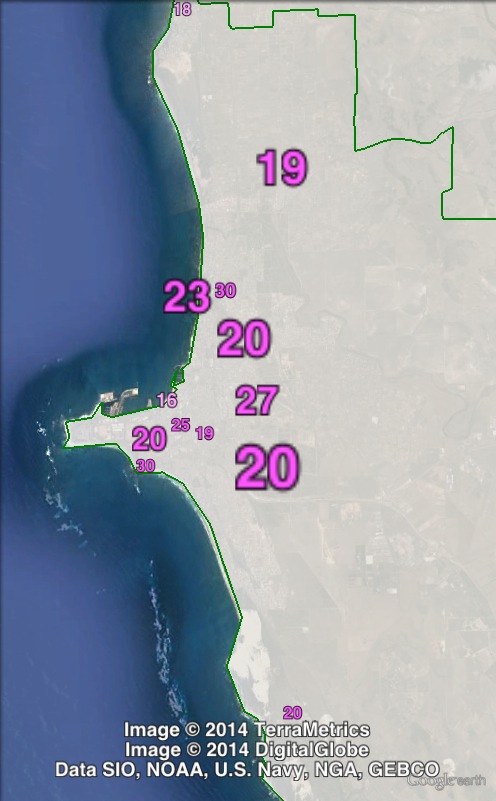
| Geraldton | 36.62 | 21.20 | 15.46 | 5.13 | 15,434 | 19.90 |
| Pilbara | 32.65 | 26.82 | 13.45 | 5.12 | 11,165 | 14.39 |
| Wheatbelt | 35.01 | 11.99 | 30.40 | 3.16 | 8,958 | 11.55 |
| Kimberley | 26.99 | 30.90 | 9.80 | 15.09 | 6,826 | 8.80 |
| Mid West | 35.25 | 16.47 | 25.26 | 3.96 | 6,465 | 8.33 |
| Gascoyne | 30.62 | 22.13 | 20.14 | 5.96 | 3,272 | 4.22 |
| Other votes | 35.63 | 23.12 | 15.15 | 6.54 | 25,446 | 32.81 |