LIB 13.7%
Incumbent MP
Martin Dixon, since 2002. Previously Member for Dromana 1996-2002.
Geography
Mornington Peninsula. Nepean covers the southernmost part of Mornington Peninsula, including Point Nepean.
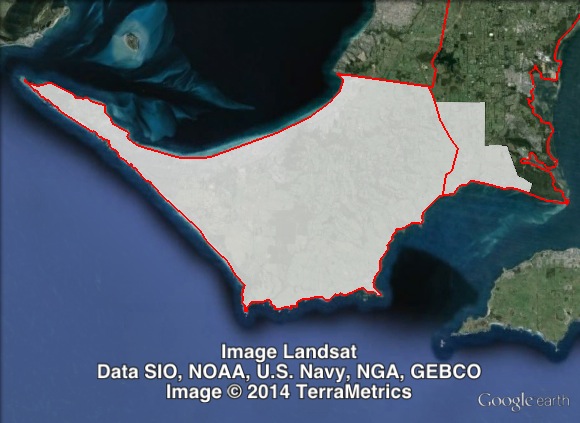
Redistribution
Nepean maintained all of its territory from the 2010 election, and expanded east to take in Balnarring and Somers. These changes cut the Liberal margin from 14.3% to 13.7%.
History
Nepean was created in 2002, replacing the abolished seat of Dromana, which had always been held by the Liberal Party since its creation in 1967.
Dromana was won in 1996 by Martin Dixon. He was re-elected in 1999. In 2002 he ran for Nepean, which had a 6.3% notional margin for the Liberal Party. He suffered a large swing, and held on with a 0.2% margin.
In 2006, Dixon gained a 9% swing, taking Nepean out of the marginal seat category. Dixon increased his margin further to 14.3% in 2010.
Martin Dixon has served as Minister for Education since 2010.
Candidates
- Matthew Schmidt (Country Alliance)
- Martin Dixon (Liberal)
- Carolyn Gleixner (Labor)
- Laura Yue (Rise Up Australia)
- David Stanton (Independent)
- Craig Thomson (Greens)
Assessment
Nepean is a safe Liberal seat.
2010 election result
| Candidate | Party | Votes | % | Swing | Redist |
| Martin Dixon | Liberal | 20,700 | 59.74 | +5.15 | 58.87 |
| John Lannan | Labor | 9,333 | 26.94 | -4.95 | 26.85 |
| Anton Vigenser | Greens | 4,176 | 12.05 | +1.22 | 12.77 |
| Keith Lyon | Country Alliance | 439 | 1.27 | +1.27 | 1.31 |
| Sex Party | 0.10 | ||||
| Democratic Labor | 0.05 | ||||
| Family First | 0.04 | ||||
| Other independents | 0.02 |
2010 two-party-preferred result
| Candidate | Party | Votes | % | Swing | Redist |
| Martin Dixon | Liberal | 22,288 | 64.31 | +4.93 | 63.74 |
| John Lannan | Labor | 12,370 | 35.69 | -4.93 | 36.26 |
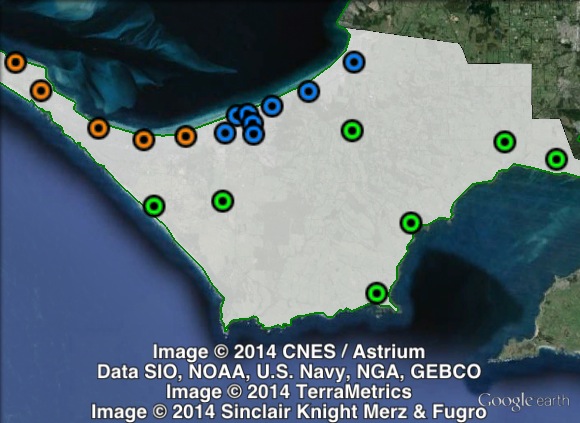
Booth breakdown
Booths in Nepean have been divided into three parts: east, south and west. Most of the population lies along the Port Phillip Bay foreshore, and these polling places were split into east and west, with the west covering the tip of the peninsula. The ‘South’ area covers those on Western Port, Bass Strait and further from the waterfront.
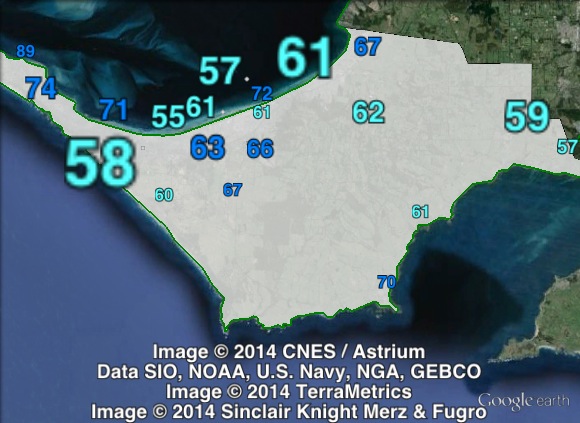
The Liberal Party won a large two-party-preferred vote in all three areas, ranging from 61.5% in the south to 64.1% in the west.
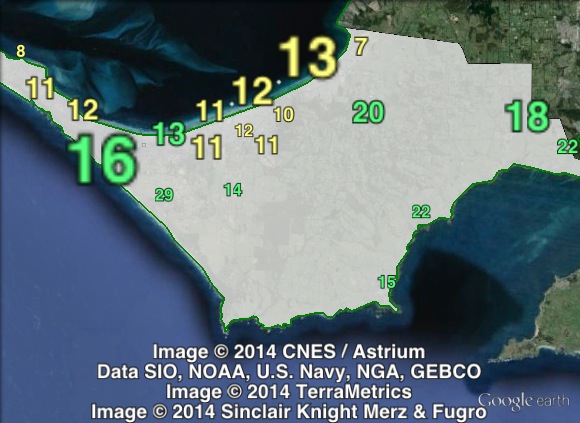
The Greens polled strongly in Nepean, ranging from 11% in the east to 19.9% in the south.
| Voter group | GRN % | LIB 2PP % | Total | % of votes |
| East | 11.03 | 62.38 | 9,903 | 26.41 |
| West | 13.53 | 64.06 | 6,790 | 18.11 |
| South | 19.87 | 61.51 | 5,807 | 15.49 |
| Other votes | 10.82 | 65.35 | 14,999 | 40.00 |
First candidate to formally nominate for this seat with the VEC is independent David Stanton. I have no further details re him.
The Green has an unfortunate name which is the same as the HSU crook and former federal ALP MP.
Also nominated here is Matthew Schmidt for Country Alliance