LNP 3.73%
Incumbent MP
Steve Davies, since 2012.
Geography
South-East Queensland. Capalaba covers eastern parts of Greater Brisbane in Redland local council area, specifically the suburbs of Capalaba, Alexandra Hills and parts of Birkdale and Thorneside.
History
The seat of Capalaba was created in 1992. Labor held the seat continuously from 1992 to 2012.
The seat was first won by Jim Elder, who had won the seat of Manly in 1989 and moved to Capalaba after his original seat was abolished.
Elder joined the Goss ministry in 1992 and served in it until the government was defeated in 1996. He became Deputy Opposition Leader in 1996 and became Deputy Premier in the Beattie government in 1998.
Elder resigned from the ministry and from the ALP in 2000 after adverse findings against him from the Shepherdson Inquiry into branch-stacking. He served out the remainder of his term as an independent until retiring in 2001.
At the 2001 election, the ALP’s Michael Choi was elected in Capalaba. He was re-elected in 2004, 2006 and 2009.
In 2012, Choi was defeated by LNP candidate Steve Davies.
Candidates
- Erin Payne (Greens)
- Steve Davies (Liberal National)
- Don Brown (Labor)
Assessment
Capalaba was a safe Labor seat prior to 2012, and should swing back to Labor with enough votes to give Labor the seat.
2012 election result
| Candidate | Party | Votes | % | Swing |
| Steve Davies | Liberal National | 13,345 | 46.54 | +9.63 |
| Michael Choi | Labor | 11,004 | 38.37 | -14.90 |
| Penny Allman-Payne | Greens | 2,168 | 7.56 | -2.26 |
| Graeme Moorhouse | Katter’s Australian | 1,708 | 5.96 | +5.96 |
| David Chidgey | One Nation | 450 | 1.57 | +1.57 |
2012 two-party-preferred result
| Candidate | Party | Votes | % | Swing |
| Steve Davies | Liberal National | 14,144 | 53.73 | +13.4 |
| Michael Choi | Labor | 12,182 | 46.27 | -13.40 |
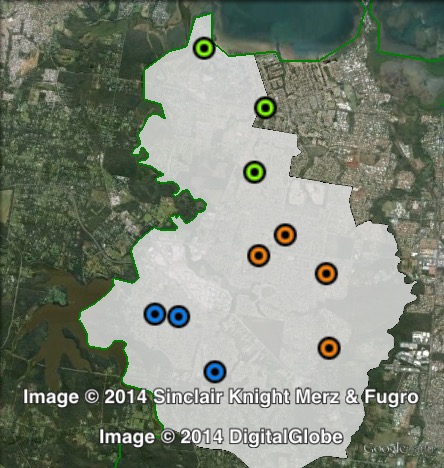
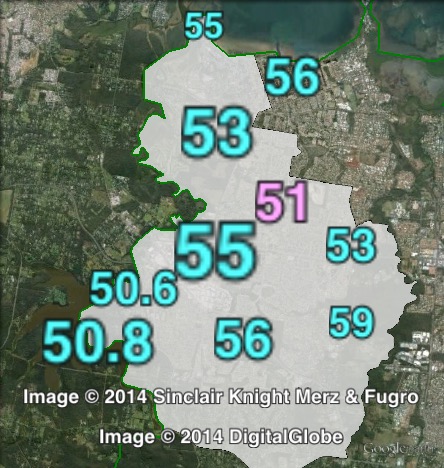
Booth breakdown
Booths in Capalaba have been divided into three parts: north, south-east and south-west.
The Liberal National Party topped the primary vote and won a majority of the two-party-preferred vote in all three areas. The LNP’s primary vote was around 46-47% in all three areas, with a two-party-preferred vote ranging from 52.5% in the south-west to 54.5% in the north.
Labor came second, with a vote ranging from 37.2% in the north to 40.5% in the south-west.
The Electoral Commission does not publish two-party-preferred figures by polling place, so two-party-preferred figures in the following table and map are estimates.
| Voter group | LNP prim % | ALP prim % | LNP 2PP % | Total | % of votes |
| South-East | 46.67 | 38.23 | 53.87 | 8,896 | 31.02 |
| South-West | 46.27 | 40.49 | 52.50 | 6,508 | 22.70 |
| North | 47.00 | 37.18 | 54.52 | 6,336 | 22.10 |
| Other votes | 46.20 | 37.66 | 53.99 | 6,935 | 24.18 |
Steve Davies is running again for the LNP. One seat where the sitting MP could hold on against the tide. Davies has been one of the standout first term MPs for the LNP and is working extremely hard. The campaign in Capalaba has already got dirty with the Labor candidate Don Brown throwing lots of muck. The Redlands region will swing back to Labor this time, but I think the swing will be mainly in Redlands and not as much in Capalaba. However the margin for Davies to hold on is slim, so Labor would start the favourites.
I agree Steve is a good look local member but that margin is too small unless fortunes dramatically improve . If he was on 6% I could see him surviving a larger statewide swing of 7-9%
My prediction: Likely ALP gain, the only Redlands area seat which the ALP will take back in 2015.