LNP 18.17%
Incumbent MP
Jack Dempsey, since 2006.
Geography
Central Queensland. The seat of Bundaberg covers the central suburbs of the Bundaberg urban area.
History
The seat of Bundaberg has existed continuously since 1888. The sitting MP is the first non-Labor MP for the seat since 1896.
Clem Campbell won the seat for the ALP in 1983. He held the seat until his retirement in 1998, when he was succeeded by Nita Cunningham.
Cunningham was re-elected in 2001 and 2004. In 2006 she resigned due to health issues. A by-election was not held, as Cunningham’s resignation prompted Peter Beattie to call an early election.
Bundaberg was won in 2006 by the National Party’s Jack Dempsey. Dempsey won re-election in 2009 and 2012.
Candidates
- Meg Anderson (Greens)
- Richard Freudenberg (Independent)
- Jack Dempsey (Liberal National)
- Robert Brown (Palmer United)
- Leanne Donaldson (Labor)
Assessment
Bundaberg was a long-term Labor seat. From 1896 to 2006, Bundaberg was almost always held by Labor, and when it wasn’t held by the ALP the seat was held by independent Labor MPs.
Yet Bundaberg was won by the Nationals for the first time in 2006, and Dempsey increased his margin in 2009 and 2012.
While Bundaberg is not out of the reach of Labor, they would need to do very well to win the seat in 2015.
2012 election result
| Candidate | Party | Votes | % | Swing |
| Jack Dempsey | Liberal National | 14,193 | 53.16 | -0.55 |
| Cindy Hyland | Labor | 6,335 | 23.73 | -17.85 |
| Doug Anderson | Katter’s Australian | 4,117 | 15.42 | +15.42 |
| Trevor Versace | Family First | 841 | 3.15 | +3.15 |
| Peter Higgins | Greens | 785 | 2.94 | -1.77 |
| Peter Wyatt | Independent | 428 | 1.60 | +1.6 |
2012 two-party-preferred result
| Candidate | Party | Votes | % | Swing |
| Jack Dempsey | Liberal National | 15,900 | 68.17 | +12.15 |
| Cindy Hyland | Labor | 7,423 | 31.83 | -12.15 |
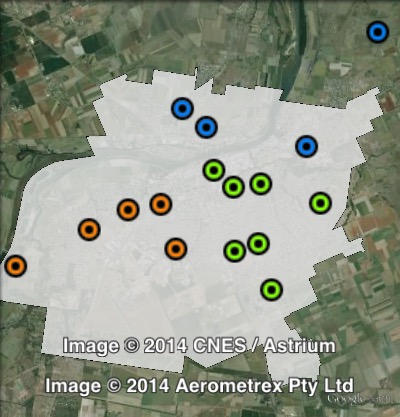
Booth breakdown
Booths in Bundaberg have been divided into three parts: central, north and west.
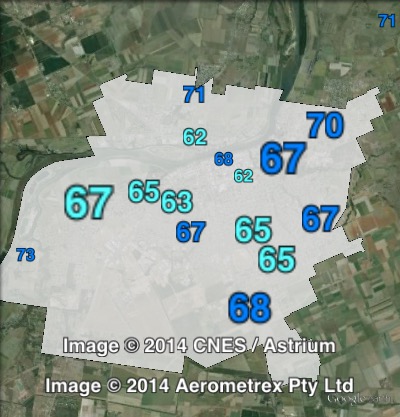
The Liberal National Party topped the poll in all three areas, winning a two-party-preferred vote ranging from 66.4% in the centre to 68.5% in the north. On primary votes, the LNP’s vote ranged from 49.9% in the centre to 53.1% in the north.
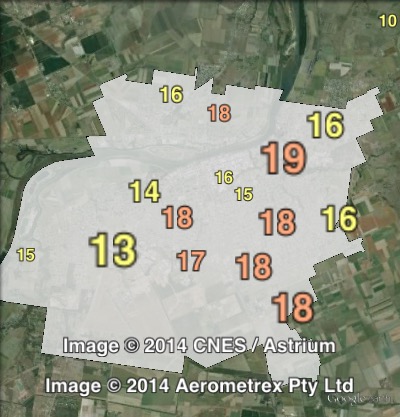
Labor came second, with a primary vote ranging from 23.4% in the north to 25.2% in the west.
Katter’s Australian Party came third, with a vote ranging from 15.2% in the west to 17.4% in central Bundaberg.
The Electoral Commission does not publish two-party-preferred figures by polling place, so two-party-preferred figures in the following table and map are estimates.
| Voter group | LNP prim % | ALP prim % | KAP prim % | LNP 2PP % | Total | % of votes |
| Central | 49.90 | 24.29 | 17.41 | 66.43 | 8,529 | 31.95 |
| West | 51.82 | 25.19 | 15.20 | 66.54 | 5,689 | 21.31 |
| North | 53.11 | 23.36 | 16.02 | 68.51 | 3,459 | 12.96 |
| Other votes | 57.10 | 22.41 | 13.44 | 70.67 | 9,022 | 33.79 |
My prediction: LNP retain, considering the trend to the LNP here. The ALP would have to do really well to win Bundaberg back.
who won?