LAB 17.40% vs NAT
Incumbent MP
Grant Robertson, since 2008.
Other local MPs
Paul Foster-Bell (National), list MP since 2013.
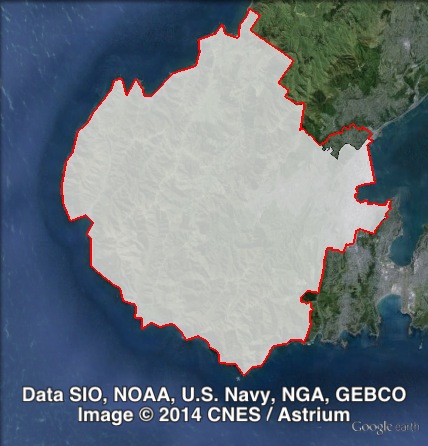
Geography
Wellington. The electorates covers the Wellington city centre and nearby suburbs including Brooklyn, Karori, Kelburn, Mt Cook, Mt Victoria, Northland, Oriental City, Thorndon and Wilton. Most of the population is clustered at the eastern edge of the electorate.
Redistribution
Wellington Central lost Wadestown to Ōhariu on the northern border. These changes increased the Labour margin from 16.6% to 17.4%.
History
The electorate of Wellington Central was first created in 1905. The seat has existed ever since, except for one term from 1993 to 1996. The seat has been dominated by Labour in recent decades, except for the early 1990s.
Wellington Central was held by three Labour MPs from 1918 to 1960. Two successive National MPs held the seat from 1960 to 1981.
Labour’s Fran Wilde won Wellington Central in 1981. She was re-elected in 1984, 1987 and 1990. She resigned in 1992 to run for Mayor of Wellington. She served as mayor until 1995.
Labour’s Chris Laidlaw won the 1992 by-election.
Wellington Central was renamed Wellington-Karori in 1993. At that election, National candidate Pauline Gardiner defeated Laidlaw.
Gardiner quit the National Party in 1995 and joined the United New Zealand party. She lost her seat in 1996.
At the 1996 election, Wellington Central was restored to its original name, and it was won by the ACT party’s Richard Prebble. Prebble had previously served as a Labour MP in Auckland from 1975 to 1993, and served as a minister in the Labour government in the 1980s. He helped found the ACT party, and led the party into the 1996 election.
In 1999, Prebble lost in Wellington Central to Labour list MP Marian Hobbs. Prebble was elected on the party list.
Marian Hobbs had first been elected as a list MP in 1996. Hobbs served as a minister in the Labour government from 1999 to 2005.
At the 2002 election, Hobbs was re-elected in Wellington Central. Prebble was re-elected on the party list for one final term (before retiring in 2005), but did not run in Wellington Central.
Two other list MPs who had run in other seats in 1999 were elected to second terms in 2002 after running in Wellington Central: ACT’s Stephen Franks and the Green Party’s Sue Kedgley. Franks left Parliament in 2005. Sue Kedgley was re-elected after running in Wellington Central in 2005 and 2008, and retired in 2011.
In 2005, National candidate Mark Blumsky was elected on the party list, and served one term before stepping down in 2008.
In 2008, Marian Hobbs retired and Wellington Central was won by Labour’s Grant Robertson. Sue Kedgley was elected to a fourth and final term as a list MP, and ACT list MP Heather Roy was elected as a third term. Roy served as an MP from 2002 to 2011.
Grant Robertson was re-elected in 2011. He was elected deputy leader of the Labour Party after the 2011 election, and served in the role until 2013. Robertson ran for the Labour leadership in 2013, and came second.
National candidate Paul Foster-Bell missed out on election on the party list in 2011, but filled a vacancy in 2013.
Candidates
- Hugh Barr (New Zealand First #20)
- Paul Foster-Bell (National #46), list MP.
- Alistair Gregory (Legalise Cannabis #4)
- Brian Hooper (Conservative)
- Huimaono Geoff Karena Puhi (Independent)
- James Knuckey (Democrats #10)
- Grant Robertson (Labour #3), Member for Wellington Central.
- James Shaw (Green #12)
- Callum Valentine (Internet #20)
Assessment
Wellington Central is a reasonably safe Labour seat, and Grant Robertson should have no trouble winning re-election.
On the party vote, the electorate has the highest Green party vote in the country, at 27.9%. The second-highest Green vote is next door in Rongotai. So the Green Party will be relying on a high vote in Wellington Central to ensure a good national result. The Green candidate, James Shaw, is the highest-ranked Green candidate who is not a sitting MP, and is joined by Green Party co-leader Russell Norman running next door in Rongotai.
2011 election results
| Electorate Votes | Party Votes | ||||||||
| Candidate | Party | Votes | % | Swing | Redist | Votes | % | Swing | Redist |
| Grant Robertson | Labour | 18,836 | 49.15 | +6.97 | 49.44 | 10,459 | 26.56 | -8.01 | 26.79 |
| Paul Foster-Bell | National | 12,460 | 32.51 | -4.96 | 32.04 | 15,128 | 38.42 | +3.01 | 38.02 |
| James Shaw | Green | 5,225 | 13.63 | -1.14 | 13.78 | 10,903 | 27.69 | +7.08 | 27.89 |
| Stephen Whittington | ACT | 412 | 1.07 | -1.21 | 1.06 | 462 | 1.17 | -2.78 | 1.17 |
| Michael Appleby | Legalise Cannabis | 404 | 1.05 | +0.05 | 1.08 | 161 | 0.41 | +0.15 | 0.41 |
| Ben Craven | New Zealand First | 279 | 0.73 | +0.73 | 0.74 | 1,132 | 2.88 | +1.35 | 2.89 |
| Gynn Rickerby | Pirate | 277 | 0.72 | +0.72 | 0.72 | ||||
| Paul Stipkovits | Conservative | 236 | 0.62 | +0.62 | 0.60 | 270 | 0.69 | +0.69 | 0.70 |
| Reagan Cutting | Libertarianz | 69 | 0.18 | -0.01 | 0.18 | 40 | 0.10 | -0.01 | 0.10 |
| Kelly Buchanan | Alliance | 52 | 0.14 | +0.04 | 0.14 | 18 | 0.05 | 0.00 | 0.04 |
| Laurence Boomert | New Economics | 44 | 0.11 | +0.11 | 0.12 | ||||
| Puhi Karena | Independent | 32 | 0.08 | +0.08 | 0.08 | ||||
| Māori | 278 | 0.71 | -0.15 | 0.67 | |||||
| United Future | 256 | 0.65 | -0.35 | 0.63 | |||||
| Mana | 250 | 0.63 | +0.63 | 0.65 | |||||
| Democrats | 15 | 0.04 | +0.03 | 0.04 | |||||
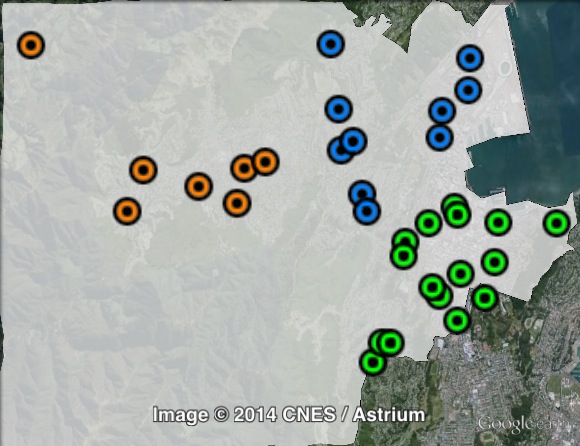
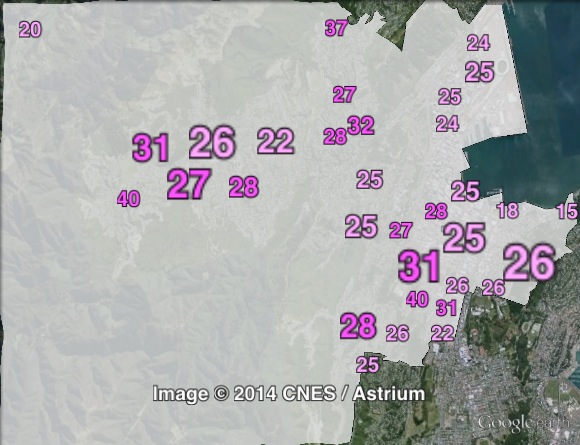
Booth breakdown
Booths in Wellington Central have been divided into central, west and north. “West” largely aligns with the suburb of Karori.
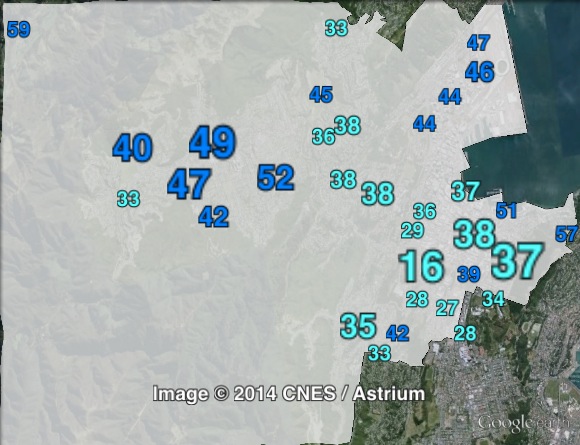
Labour won a majority of the electorate vote in Central and North, and a plurality with 47.4% in the West.
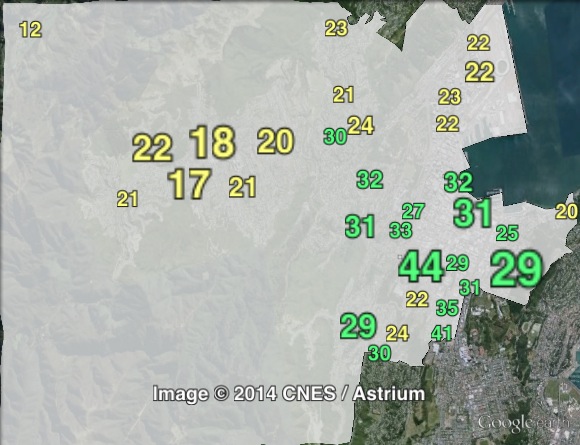
On the party vote, Labour’s vote was much, much lower. Labour polled less than half as much on the party vote in Central and West, and over 20% lower in the West. Labour came third, behind the Green Party, in Central and North.
The National electorate vote ranged from 28.4% in Central to 40% in the West. This compares to a party vote ranging from 35% in Central to 45.4% in the West. National won a plurality of the party vote in all three areas, but in Central and North the combined Labour-Green vote outpolled the National Party.
The Green electorate vote ranged from 8.9% in the West to 15.1% in Central. The Green party vote ranged from 19.5% in the West to 30.8% in Central.
| Voter group | Electorate votes | Party votes | Total | % of votes | ||||
| LAB | NAT | GRN | NAT | GRN | LAB | |||
| Central | 51.51 | 28.39 | 15.05 | 35.06 | 30.79 | 25.74 | 11,063 | 30.71 |
| West | 47.41 | 39.95 | 8.89 | 45.42 | 19.47 | 25.32 | 6,570 | 18.24 |
| North | 51.70 | 33.02 | 10.66 | 40.55 | 25.98 | 18.00 | 6,427 | 17.84 |
| Other votes | 47.43 | 30.56 | 16.96 | 35.51 | 30.68 | 25.83 | 11,969 | 33.22 |
My prediction: Labour hold.