NAT 29.06% vs LAB
Incumbent MP
Todd McClay, since 2008.
Geography
North Island. Rotorua covers the town of Rotorua, surrounding areas and areas to the southeast of Tauranga. The seat covers most of the Rotorua council area, and a small part of the Western Bay of Plenty council area.
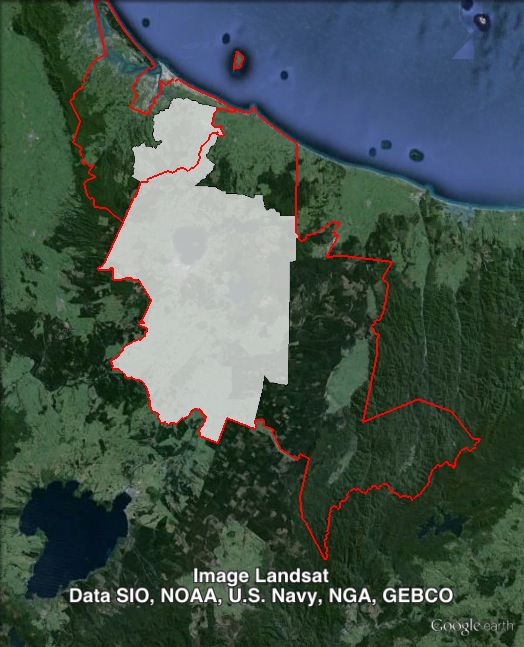
Redistribution
Rotorua shifted northwest, losing sparsely-populated areas in the west of the electorate, including coastal parts of Rotorua council area. In exchange, Rotorua shifted much closer to the Tauranga urban area. These changes increased the National margin from 24% to 29%.
History
The electorate of Rotorua has existed for two different periods: 1919-1946, and since 1954. Since 1954, the seat has mostly been won by National, except for two Labour wins in 1954 and 1957, and three Labour wins in 1999, 2002 and 2005.
In 1996, sitting MP Paul East shifted to the National list after holding Rotorua since 1978. He served as a list MP for one term and retired in 1999.
Max Bradford had held the neighbouring seat of Tarewera since 1990. His seat was abolished in 1996, and he shifted to Rotorua.
In 1999, National MP Max Bradford lost to Labour candidate Steve Chadwick. Bradford won a seat on the National party list, and retired in 2002.
Chadwick retained Rotorua at the 2002 and 2005 elections.
Chadwick lost to National candidate Todd McClay in 2008. Chadwick served one more term as a list MP, and retired in 2011.
McClay won with a 15.4% margin in 2008, and increased that to 24% in 2011.
Candidates
- Tamati Coffey (Labour #30)
- Michael Davidson (Conservative)
- Todd McClay (National #23), Member for Rotorua.
- Lyall Russell (ACT)
- Fletcher Tabuteau (New Zealand First #4)
Assessment
Rotorua has a tradition of going to the party of government since 1996, but has tended to favour the National Party, and is now held by a large margin. Labour would be only able to win if they were in a very strong position on a national level.
2011 election results
| Electorate Votes | Party Votes | ||||||||
| Candidate | Party | Votes | % | Swing | Redist | Votes | % | Swing | Redist |
| Todd McClay | National | 17,188 | 56.17 | +2.26 | 58.57 | 16,159 | 51.27 | +0.92 | 52.99 |
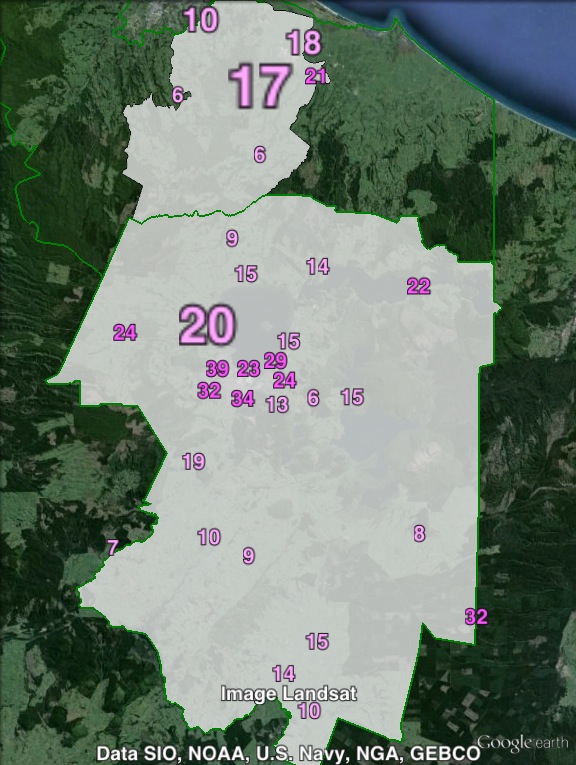
| Steve Chadwick | Labour | 9,831 | 32.13 | -6.35 | 29.51 | 6,919 | 21.95 | -8.08 | 20.55 |
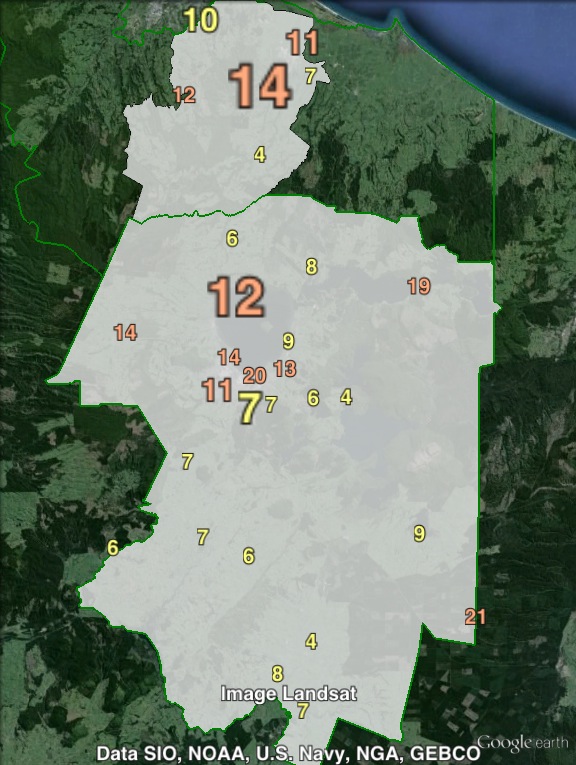
| Fletcher Tabuteau | New Zealand First | 2,166 | 7.08 | +7.08 | 7.37 | 3,326 | 10.55 | +4.21 | 10.36 |
| Daryl Smith | Conservative | 903 | 2.95 | +2.95 | 2.99 | 948 | 3.01 | +3.01 | 3.18 |
| Grant Rogers | Mana | 510 | 1.67 | +1.67 | 1.45 | 327 | 1.04 | +1.04 | 0.81 |
| Green | 2,700 | 8.57 | +3.58 | 8.64 | |||||
| Māori | 404 | 1.28 | -0.50 | 1.20 | |||||
| ACT | 269 | 0.85 | -1.78 | 0.82 | |||||
| United Future | 0.10 | 258 | 0.82 | -0.02 | 0.78 | ||||
| Legalise Cannabis | 159 | 0.50 | +0.06 | 0.50 | |||||
| Libertarianz | 19 | 0.06 | +0.02 | 0.07 | |||||
| Alliance | 15 | 0.05 | -0.05 | 0.05 | |||||
| Democrats | 14 | 0.04 | +0.02 | 0.05 | |||||
Booth breakdown
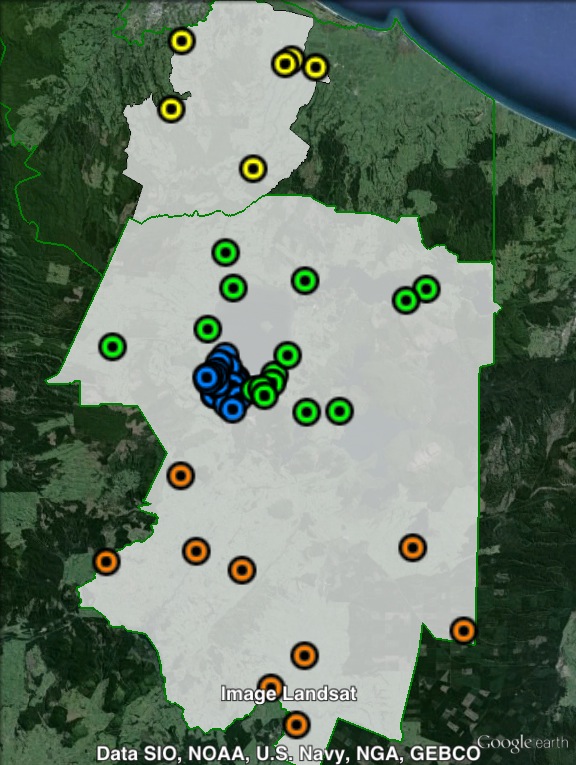
Booths in Rotorua have been divided into four parts. Polling places in the Rotorua urban area have been grouped together. Rural booths in the Rotorua council area have been split into “central” and “south”, with booths in the Western Bay of Plenty council area have been grouped into “north”.
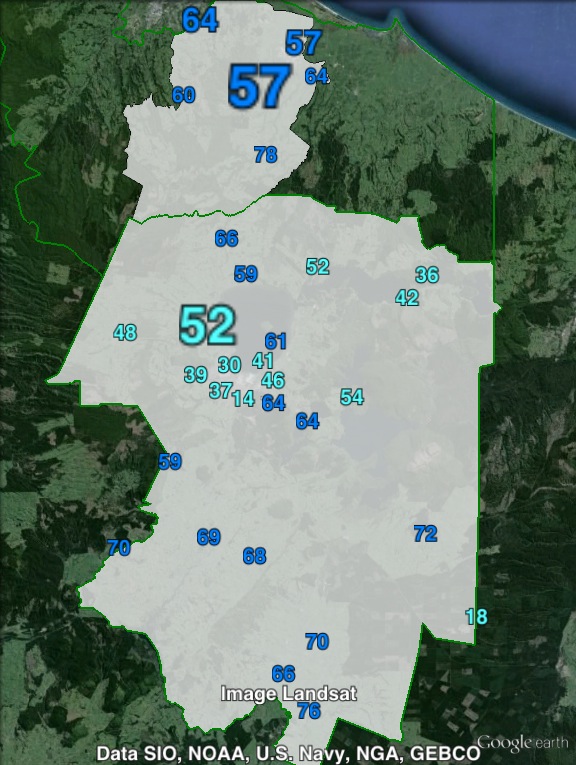
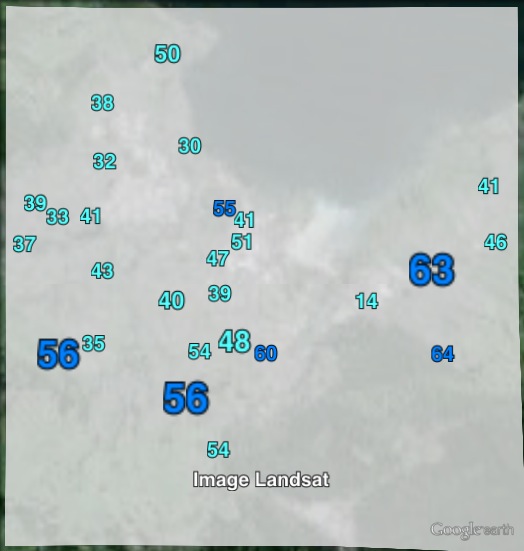
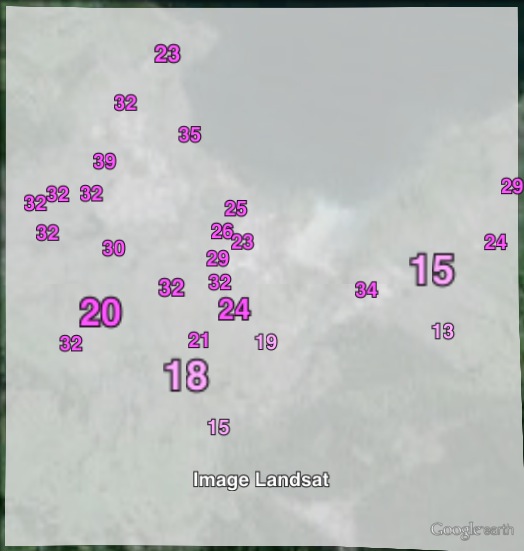
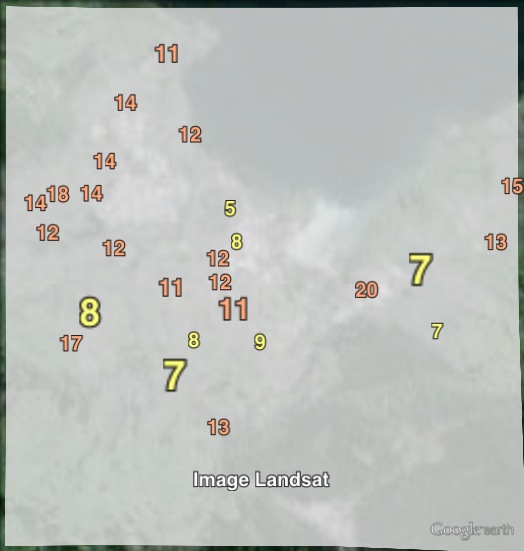
The National Party won a majority of electorate votes in all four areas, ranging from 51.3% in Rotorua to 72.8% in the south. The National Party also won a majority of the party vote in three out of four areas, winning 46.6% in Rotorua.
The National electorate vote ranges from 14.8% in Rotorua to 53.9% in the south.
| Voter group | Electorate votes | Party votes | Total | % of votes | |||||
| NAT | LAB | NZF | NAT | LAB | NZF | GRN | |||
| Rotorua | 51.25 | 36.50 | 7.49 | 46.61 | 25.88 | 11.11 | 8.93 | 12,150 | 38.15 |
| Central | 59.13 | 29.68 | 6.59 | 54.77 | 18.03 | 10.12 | 9.86 | 7,051 | 22.14 |
| North | 69.26 | 15.86 | 9.92 | 59.51 | 13.99 | 11.78 | 6.78 | 4,665 | 14.65 |
| South | 72.84 | 18.90 | 3.83 | 68.00 | 11.88 | 6.83 | 4.97 | 1,333 | 4.19 |
| Other votes | 61.01 | 28.26 | 6.91 | 55.09 | 19.83 | 9.04 | 8.82 | 6,646 | 20.87 |