NAT 31.01% vs CON
Incumbent MP
Mark Mitchell, since 2011.
Other local MPs
Tracey Martin (New Zealand First), list MP since 2011.
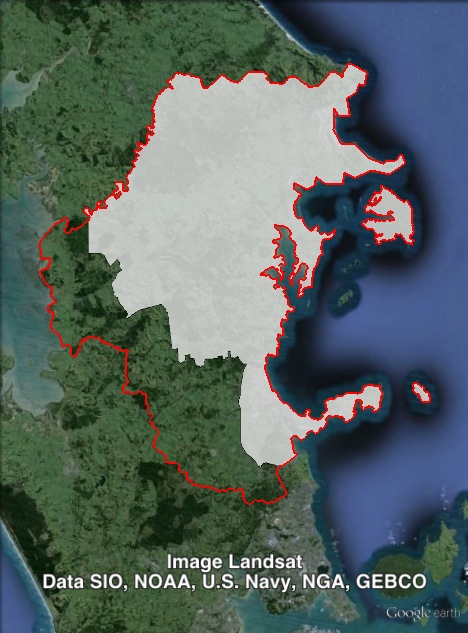
Geography
Rural areas to the north of Auckland. While the entire Rodney electorate is contained within Auckland region, it couldn’t be described as part of the Auckland urban area. Most of the population lies in the towns of Orewa and Red Beach, and the nearby Whangaparaoa Peninsula, all at the southern end of the electorate, but the seat stretches as far north as Leigh.
Redistribution
Rodney’s northern boundary has remained steady, but lost rural areas along its southwestern boundary to Helensville. These changes reduced the National margin from 32.3% to 31%.
History
The electorate of Rodney has existed for most of the period since 1946. In that time, the seat was abolished for two terms from 1978 to 1984, and again for three terms from 1987 to 1996. During that period, the seat was replaced by a seat named ‘Albany’. The two seats only overlapped for two terms from 1996 to 2002. Both Rodney and Albany have been held by National continuously since 1946.
Three National MPs held Rodney over eleven terms from 1946 to 1978. The last of those MPs was Peter Wilkinson, who held the seat from 1969 to 1978.
In 1978, Wilkinson shifted to another safe National seat north of Auckland named ‘Kaipara’, that had been restored after its abolition in 1946. Wilkinson held Kaipara until he retired at the 1984 election, and was replaced by National’s Lockwood Smith.
The seat of Albany was won in 1978 by Don McKinnon, also of the National Party. McKinnon shifted to the new seat of Rodney in 1984, and returned to Albany when Rodney was abolished in 1987. He became National deputy leader in 1987, and served as Deputy Prime Minister and Foreign Minister in the National government from 1990 to 1996.
In 1996, the neighbouring seat of Kaipara was abolished, and Rodney was restored as an electorate. Kaipara MP Lockwood Smith was elected in Rodney, and Albany MP McKinnon was re-elected on the National list. The 1996 election resulted in National forming a coalition with New Zealand First, so while McKinnon continued to hold the Foreign Affairs portfolio, he gave up the Deputy Prime Minister’s position. McKinnon was re-elected on the National list in 1999 and then retired in 2000.
Lockwood Smith had held Kaipara from 1984 to 1996, and then shifted to Rodney, which he held until 2011. Smith served as an opposition frontbencher in the late 1980s and then as a minister in the National government from 1990 to 1999, serving in a variety of portfolios including Education, Agriculture and Trade.
He was re-elected in Rodney in 1999, 2002, 2005 and 2008. During this time, Smith remained on the opposition frontbench after the National government was defeated at the 1999 election.
After National won power in 2008, Smith was elected Speaker of the House of Representatives.
In 2011, Smith stepped down as Member for Rodney and was re-elected on the National list. He retired in 2013. He currently serves as New Zealand’s High Commissioner to the United Kingdom.
Rodney was won in 2011 by National candidate Mark Mitchell. His main rival was Conservative Party leader Colin Craig, who came second with 21.2% of the vote.
Candidates
- Eric Bolt (Labour)
- Anton Heyns (Conservative #14)
- Beth Houlbrooke (ACT #4)
- Tracey Martin (New Zealand First #2)
- Malcolm McAll (Green #35)
- Mark Mitchell (National #42)
Assessment
Rodney is a safe National seat. While the Conservative Party attempted to use the seat as a path to enter Parliament in 2011, its leader Colin Craig has chosen to run in the neighbouring seat of East Coast Bays in 2014, so there will be no serious opposition to National in Rodney.
2011 election results
| Electorate Votes | Party Votes | ||||||||
| Candidate | Party | Votes | % | Swing | Redist | Votes | % | Swing | Redist |
| Mark Mitchell | National | 20,253 | 53.54 | -6.87 | 52.51 | 23,967 | 62.15 | +3.16 | 61.09 |
| Colin Craig | Conservative | 8,031 | 21.23 | +21.23 | 21.50 | 2,459 | 6.38 | +6.38 | 6.54 |
| Christine Rose | Labour | 5,170 | 13.67 | -5.13 | 14.26 | 5,178 | 13.43 | -7.19 | 14.01 |
| Teresa Moore | Green | 2,694 | 7.12 | -0.57 | 7.17 | 3,265 | 8.47 | +3.29 | 8.54 |
| Tracey Martin | New Zealand First | 1,476 | 3.90 | -0.35 | 4.06 | 2,688 | 6.97 | +2.44 | 7.32 |
| Beth Houlbrooke | ACT | 204 | 0.54 | -4.15 | 0.50 | 460 | 1.19 | -5.37 | 1.09 |
| United Future | 154 | 0.40 | -0.36 | 0.40 | |||||
| Legalise Cannabis | 151 | 0.39 | +0.03 | 0.39 | |||||
| Māori | 140 | 0.36 | -0.12 | 0.36 | |||||
| Mana | 58 | 0.15 | +0.15 | 0.16 | |||||
| Libertarianz | 18 | 0.05 | +0.02 | 0.03 | |||||
| Democrats | 13 | 0.03 | +0.01 | 0.04 | |||||
| Alliance | 12 | 0.03 | -0.03 | 0.03 | |||||
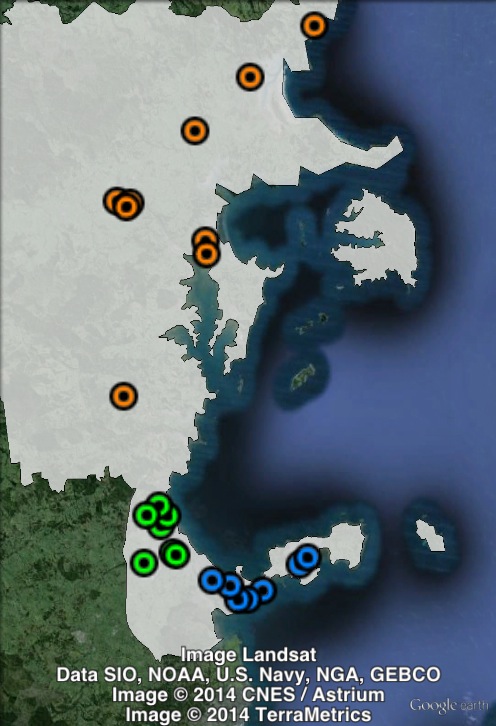
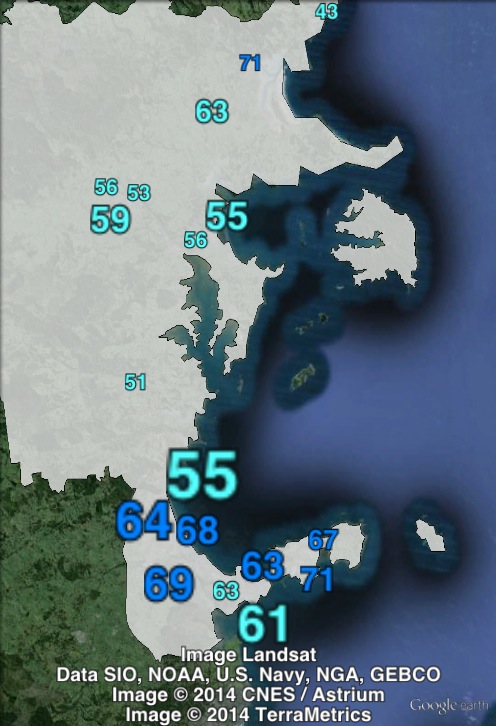
Booth breakdown
Booths in Rodney have been divided into three areas. Most of the electorate’s population lie at the southern end. These southern polling places have been split between those on the Whangaparaoa Peninsula, grouped together as ‘Peninsula’, and those in the towns of Orewa and Red Beach along the coast.
The remainder of the electorate has been grouped as ‘North’.
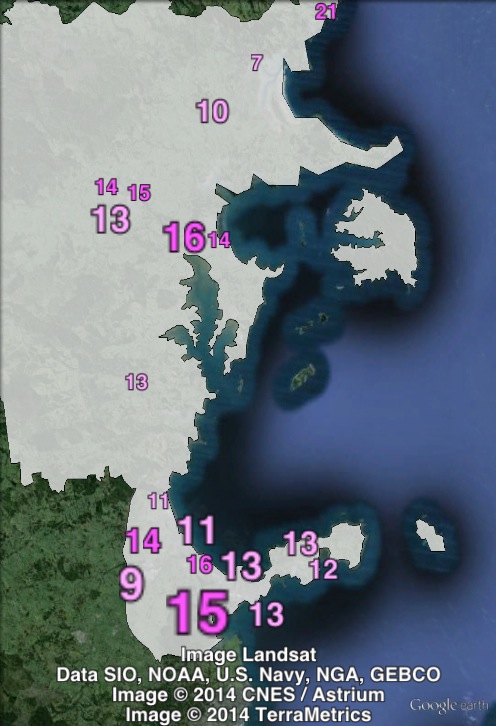
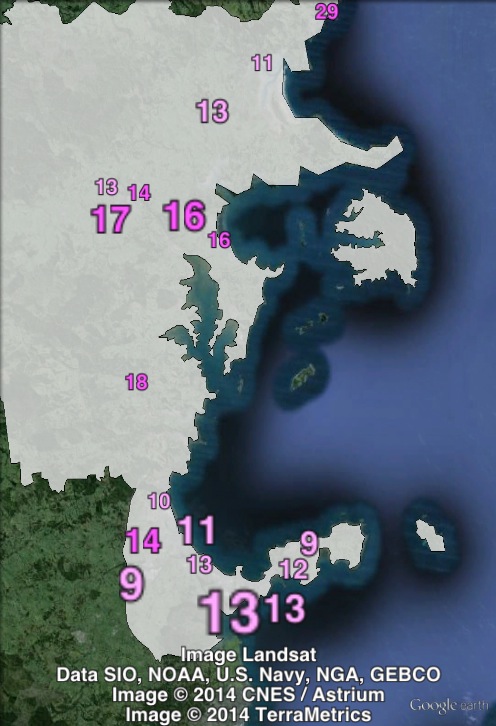
The National Party won a majority of the electorate vote in all three areas, winning the slimmest of majorities in the north. The Conservative Party came second on the electorate vote across the electorate. The National-Conservative margin ranges from 25.8% on the peninsula to 30.8% in the north.
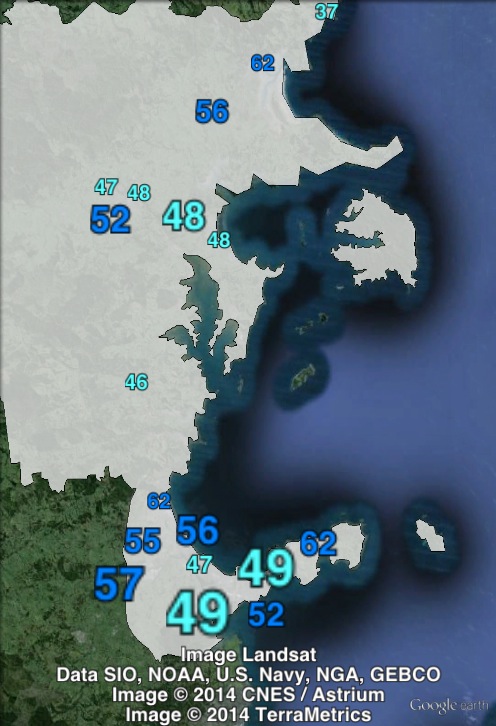
On the party vote, the Conservative Party came fifth behind National, Labour, Green and New Zealand First.
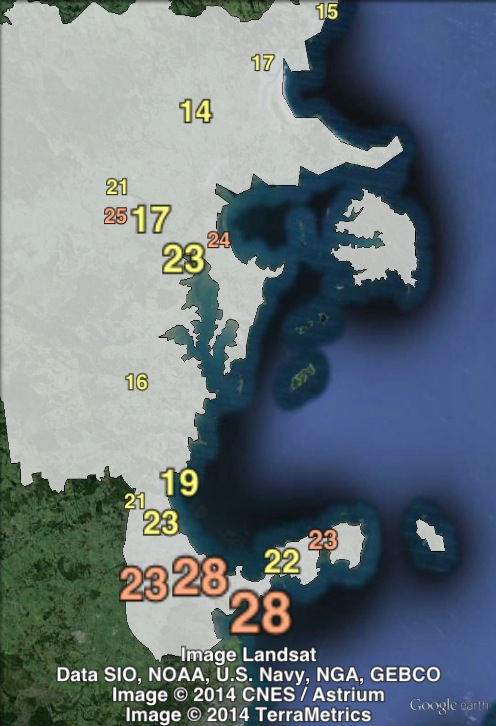
National won majorities of 63-64% in the two southern areas, and 57% in the north. Labour won around 13-14% in all three areas. In the north, the Green Party was not far behind Labour on 11.6%.
| Voter group | Electorate votes | Party votes | Total | % of votes | |||||
| NAT | CON | LAB | NAT | LAB | GRN | NZF | |||
| Orewa-Red Beach | 53.71 | 23.07 | 12.79 | 63.49 | 12.97 | 7.34 | 7.39 | 9,305 | 27.77 |
| Peninsula | 51.96 | 26.14 | 12.61 | 63.84 | 13.80 | 7.22 | 6.36 | 8,691 | 25.94 |
| North | 50.01 | 19.19 | 15.73 | 57.07 | 13.47 | 11.60 | 7.64 | 7,050 | 21.04 |
| Other votes | 53.82 | 16.91 | 16.36 | 59.06 | 15.76 | 8.67 | 7.95 | 8,457 | 25.24 |