NAT 19.79% vs LAB
Incumbent MP
Eric Roy, since 2005. Previously Member for Awarua 1993-1996, list MP 1996-2002.
Geography
Southern end of South Island. The electorate covers the City of Invercargill, as well as southern parts of the Southland council area.
Redistribution
No change.
History
The electorate of Invercargill has existed continuously since 1866. The seat has been mostly held by the National Party and its predecessor. Labour won the seat for three terms in the 1930s and 1940s, one term in 1972, and four terms in the 1990s and 2000s.
The seat expanded to cover part of the former seat of Awarua in the 1996 redistribution. Awarua had covered rural areas in the Southland area, and had been predominantly held by the National Party.
In Invercargill in 1993, National MP Rob Munro was defeated by Labour’s Mark Peck. Munro had held the seat for two terms, and the National Party had held Invercargill continuously since 1975.
In neighbouring Awarua, Eric Roy won the seat for the National Party – the third successive National MP to represent the seat since Labour lost Awarua in 1975.
In 1996, Awarua was abolished and Roy and Peck both contested Invercargill. Labour’s Peck won, and Roy stayed in Parliament as a National list MP. The same result was repeated in 1999.
In 2002, Peck was re-elected to a fourth term in Invercargill, and Roy missed out on a list seat due to the poor National Party result.
In 2005, Mark Peck retired in Invercargill. Eric Roy was returned to Parliament as the Member for Invercargill, with a 6.5% margin.
Roy was re-elected with an increased 19.2% margin in 2008, and increased it slightly further to 19.8% in 2011.
Candidates
Sitting National MP Eric Roy is not running for re-election.
- Ria Bond (New Zealand First #12)
- Stephnie de Ruyter (Democrats #1)
- Sarah Dowie (National #57)
- David Kennedy (Green #18)
- Lesley Soper (Labour)
- Laura Storr (Conservative)
Assessment
Invercargill is now a reasonably safe National seat, and would only be vulnerable in a Labour landslide.
2011 election results
| Electorate Votes | Party Votes | ||||||
| Candidate | Party | Votes | % | Swing | Votes | % | Swing |
| Eric Roy | National | 17,275 | 54.58 | -1.39 | 16,140 | 49.88 | +2.35 |
| Lesley Soper | Labour | 11,012 | 34.79 | -1.96 | 9,296 | 28.73 | -8.15 |
| David Kennedy | Green | 2,433 | 7.69 | +2.73 | 2,723 | 8.42 | +4.16 |
| Stephnie de Ruyter | Democrats | 521 | 1.65 | +1.65 | 129 | 0.40 | +0.22 |
| Ian Carline | ACT | 276 | 0.87 | -0.33 | 397 | 1.23 | -1.47 |
| Shane Pleasance | Libertarianz | 133 | 0.42 | +0.04 | 34 | 0.11 | +0.05 |
| New Zealand First | 2,213 | 6.84 | +3.44 | ||||
| Conservative | 643 | 1.99 | +1.99 | ||||
| United Future | 264 | 0.82 | -0.09 | ||||
| Legalise Cannabis | 257 | 0.79 | +0.28 | ||||
| Māori | 162 | 0.50 | -0.08 | ||||
| Mana | 63 | 0.19 | +0.19 | ||||
| Alliance | 34 | 0.11 | -0.05 | ||||
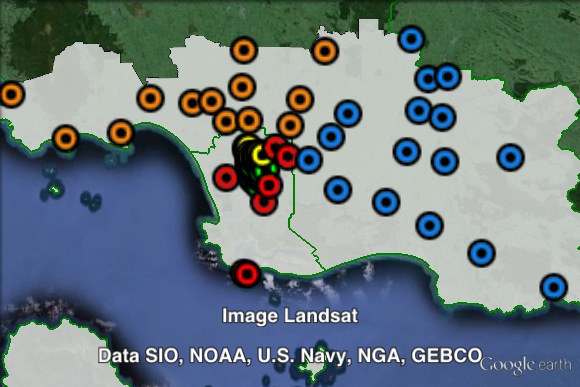
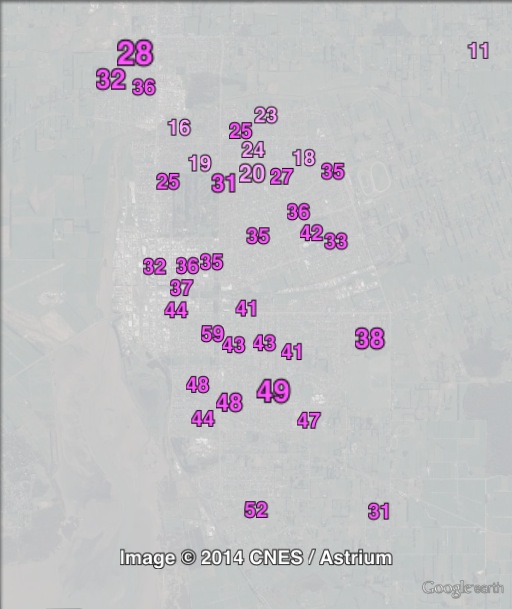
Booth breakdown
Booths in Invercargill have been divided into five areas. Polling places in the Invercargill urban area have been grouped into ‘Invercargill North’ and ‘Invercargill South’. The rural booths in the Invercargill council area have been grouped as ‘Central’.
The polling places in Southland have been divided into ‘East’ and ‘West’. Those immediately north and to the north-west of Invercargill have been grouped into ‘west’, with the remainder in ‘east’.
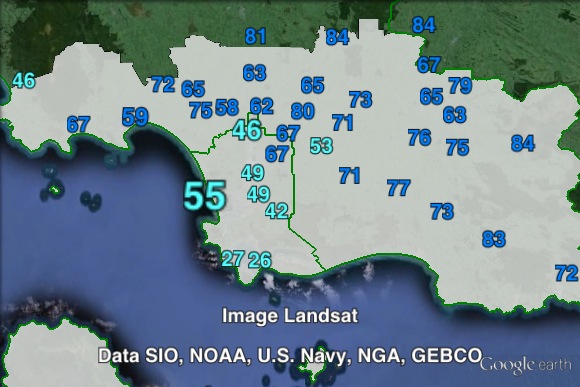
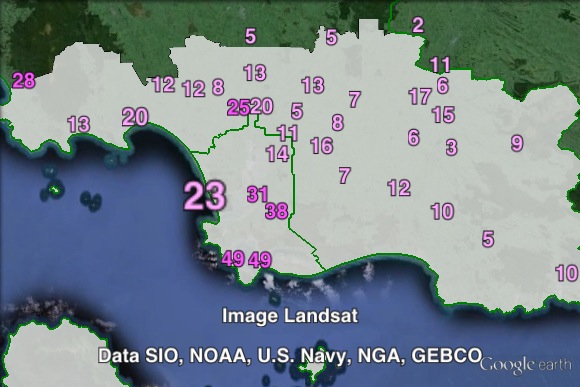
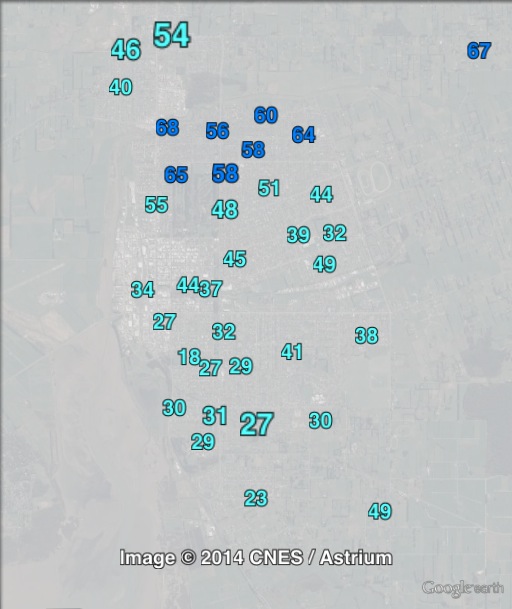
National won large majorities of the electorate vote in four out of five areas, ranging from 54.9% in Central to 78.6% in the East. Labour, however, won a majority of the electorate vote in Invercargill South. Comparing the two northern and southern suburbs of Invercargill, National won a 23% margin in the north, and Labour won a 16.7% margin in the south.
On the party vote, National won a majority in the same four areas, although by less than in the party vote. Labour won a 43.3% plurality in Invercargill South.
| Voter group | Electorate votes | Party votes | Total | % of votes | |||||
| NAT | LAB | GRN | NAT | LAB | GRN | NZF | |||
| Invercargill North | 56.12 | 33.12 | 7.62 | 52.32 | 27.61 | 8.26 | 6.62 | 10,138 | 32.03 |
| Invercargill South | 35.82 | 52.53 | 8.79 | 31.72 | 43.32 | 9.11 | 9.15 | 7,498 | 23.69 |
| Central | 54.88 | 34.82 | 7.82 | 50.10 | 27.52 | 8.49 | 7.87 | 2,981 | 9.42 |
| West | 70.04 | 21.55 | 5.19 | 64.09 | 17.07 | 5.91 | 6.73 | 2,794 | 8.83 |
| East | 78.62 | 14.24 | 3.68 | 70.53 | 10.69 | 4.39 | 4.61 | 2,283 | 7.21 |
| Other votes | 58.97 | 29.38 | 9.05 | 53.84 | 25.34 | 10.42 | 4.75 | 5,956 | 18.82 |
My prediction: National hold.