LAB 9.91% vs NAT
Incumbent MP
Trevor Mallard, since 1996. Previously Member for Hamilton West 1984-1990, Member for Pencarrow 1993-1996.
Other local MPs
- Holly Walker (Green), list MP since 2011.
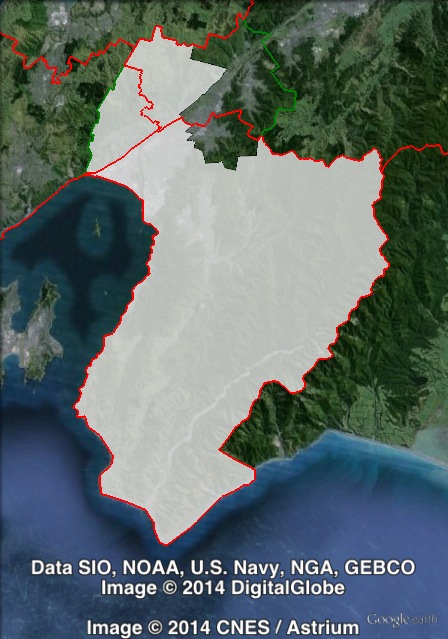
Geography
Suburbs of Wellington. Hutt South lies entirely within the Lower Hutt council area, with most of the population living in the Lower Hutt urban area. Its eastern, western and southern boundaries align with those of Lower Hutt council, but northern parts of Lower Hutt are contained in the neighbouring seat of Rimutaka.
Redistribution
The electorate’s northeastern boundary previously aligned with Hutt Road, with suburbs to the northeast of Hutt Road contained in Rimutaka and Ōhariu. In exchange, Hutt South lost Naenae to Rimutaka. These changes cut the Labour margin from 15% to 9.9%.
History
The electorate of Hutt South has existed since the 1996 election. It replaced two previous electorates that were also centred on Lower Hutt: Petone (1946-1978) and Pencarrow (1978-1996). All three of these seats have been held by Labour continuously since 1946.
Trevor Mallard won Pencarrow in 1993. Mallard had previously held the seat of Hamilton West from 1984 to 1990.
Mallard was appointed as a minister in the Labour government in 1999, and served in a variety of ministries until 2008. He’s continued to serve as a senior frontbencher since Labour lost power in 2008.
In 1996, National candidate Joy Quigley and New Zealand First candidate Deborah Morris were both elected on their party’s lists.
Quigley had held Western Hutt since 1990. She served as a list MP for one term before retired in 1999. Morris left New Zealand First in 1998, and resigned from Parliament in 1999 prior to the 1999 election.
In 2002, United Future candidate Murray Smith was elected as a list MP, and lost his seat in 2005.
In 2008, National candidate Paul Quinn was elected on the party list. He narrowly missed out on re-election in 2011, and in 2013 decided not to take up an opportunity to re-enter Parliament.
In 2011, Green candidate Holly Walker was elected on the Green party list.
Candidates
- Chris Bishop (National #49)
- Gordon Copeland (Conservative)
- Trevor Mallard (Labour), Member for Hutt South.
- Grae O’Sullivan (ACT #37)
- Jan Pajak (Independent)
- Mataroa Paroro (New Zealand First #13)
- Dave Stonyer (United Future #7)
- Holly Walker (Green), list MP. Walker was originally ranked 12th on the Green Party but stepped down from the party’s list in June 2014 due to personal reasons.
Assessment
Hutt South and its predecessors have always been held by Labour. The recent redistribution was not friendly to Trevor Mallard, cutting his margin from 15% to 9.9%. Despite these changes, a 10% margin is still reasonably solid. National has claimed that it is seriously targetting Hutt South, but it will be difficult for them to win the seat.
On the party vote, the National Party’s vote has increased by over 4% due to the boundary changes. The Labour party vote dropped from almost 48% in 2005 to 35.7% in 2011. Labour will be hoping to bump up that party vote if they have a chance of forming government.
2011 election results
| Electorate Votes | Party Votes | ||||||||
| Candidate | Party | Votes | % | Swing | Redist | Votes | % | Swing | Redist |
| Trevor Mallard | Labour | 15,828 | 49.38 | +0.10 | 44.62 | 11,751 | 35.70 | -7.09 | 31.07 |
| Bernard Quinn | National | 11,003 | 34.33 | -2.89 | 34.71 | 13,510 | 41.05 | +3.21 | 45.21 |
| Holly Walker | Green | 3,693 | 11.52 | +3.74 | 11.07 | 3,940 | 11.97 | +4.28 | 12.86 |
| Gordon Copeland | Conservative | 1,015 | 3.17 | +3.17 | 2.64 | 667 | 2.03 | +2.03 | 2.02 |
| Robert Eaddy | United Future | 342 | 1.07 | -1.33 | 6.26 | 294 | 0.89 | -0.53 | 1.04 |
| Richard Speirs | ACT | 172 | 0.54 | -1.40 | 0.50 | 249 | 0.76 | -2.00 | 0.79 |
| New Zealand First | 0.17 | 1,974 | 6.00 | +2.50 | 5.49 | ||||
| Māori | 196 | 0.60 | -0.25 | 0.59 | |||||
| Legalise Cannabis | 157 | 0.48 | +0.11 | 0.46 | |||||
| Mana | 123 | 0.37 | +0.37 | 0.29 | |||||
| Libertarianz | 0.03 | 23 | 0.07 | -0.03 | 0.07 | ||||
| Alliance | 18 | 0.05 | -0.08 | 0.06 | |||||
| Democrats | 12 | 0.04 | +0.02 | 0.04 | |||||
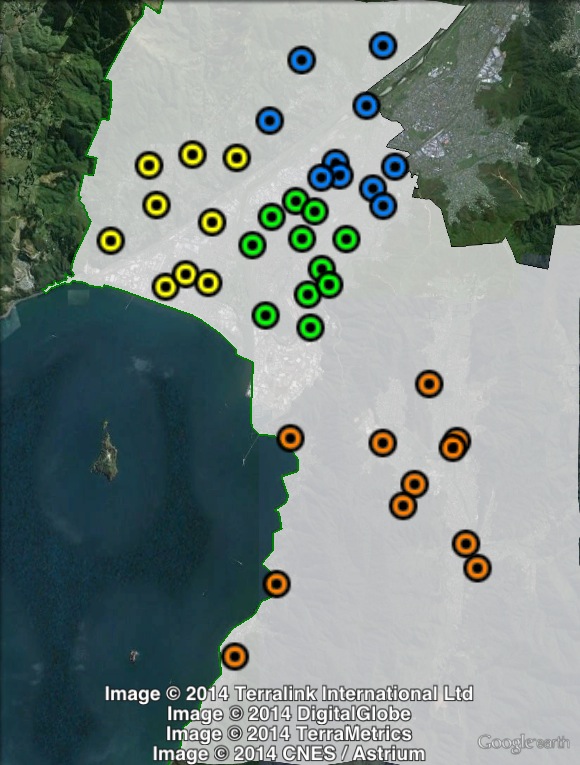
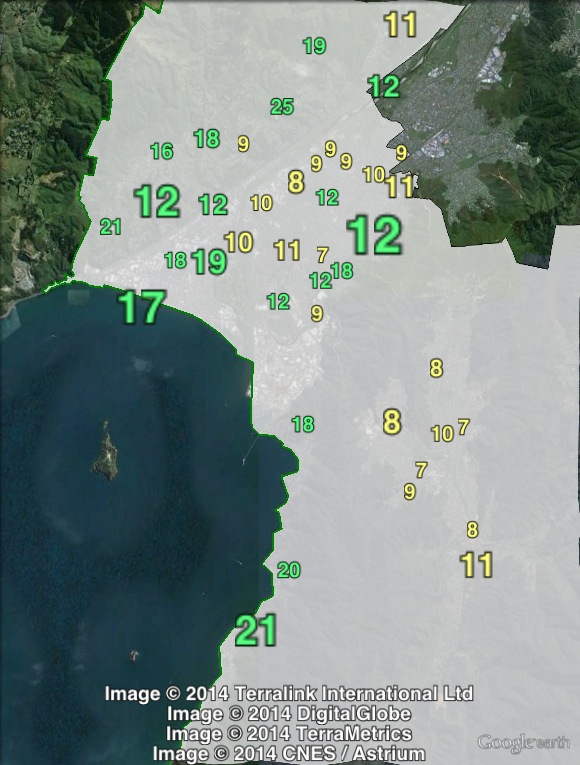
Booth breakdown
Booths in Hutt South have been divided into four areas. Polling places in the Lower Hutt urban area have been split into Central, East and North, and a cluster of semi-rural booths to the south of Lower Hutt have been grouped as ‘south’.
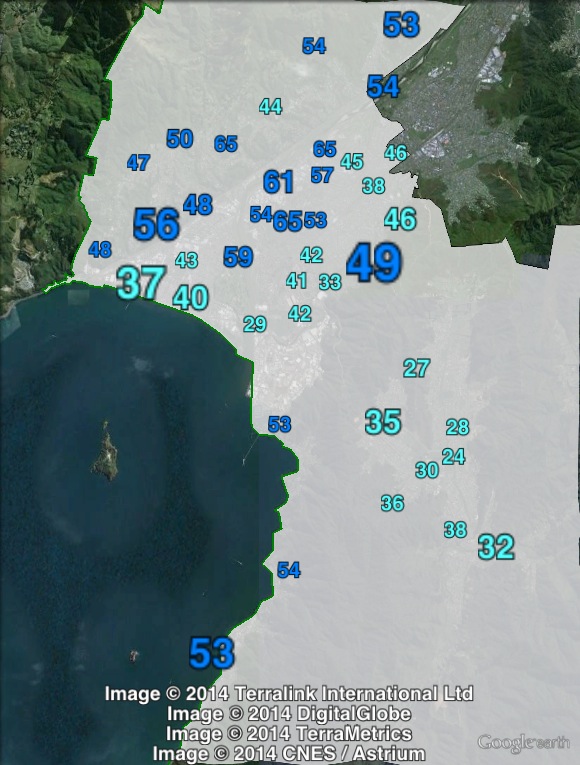
Labour won the electorate vote in the south and the east, with the Labour vote peaking at 55.7% in the south. National won, with smaller margins, in Central (3.2% margin) and North (4.3%).
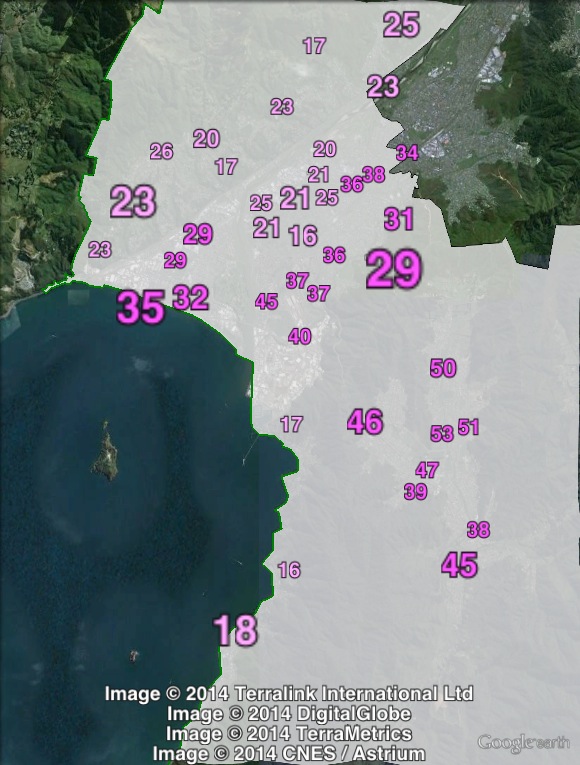
On the party vote, National won a majority in Central and North. Labour won with a 20.2% margin in the east, while National narrowly topped the poll in South. The Greens came third in Hutt South, with a party vote ranging from 10.9% in Central to 15.6% in East.
| Voter group | Electorate votes | Party votes | Total | % of votes | |||||
| LAB | NAT | GRN | NAT | LAB | GRN | NZF | |||
| Central | 40.36 | 43.57 | 10.67 | 50.36 | 28.12 | 10.89 | 5.46 | 7,991 | 21.29 |
| South | 55.65 | 28.31 | 11.32 | 37.55 | 38.18 | 11.77 | 6.67 | 7,676 | 20.45 |
| East | 39.77 | 25.97 | 10.77 | 47.37 | 27.18 | 15.56 | 4.77 | 7,240 | 19.29 |
| North | 40.14 | 44.42 | 9.76 | 50.81 | 26.76 | 11.64 | 5.35 | 6,096 | 16.24 |
| Other votes | 46.02 | 32.66 | 12.39 | 41.60 | 33.67 | 14.24 | 5.18 | 8,531 | 22.73 |
My prediction: Likely Labour hold.