LAB 18.82% vs NAT
Incumbent MP
Poto Williams, since 2013.
Other local MPs
Mojo Mathers (Green), list MP since 2011.
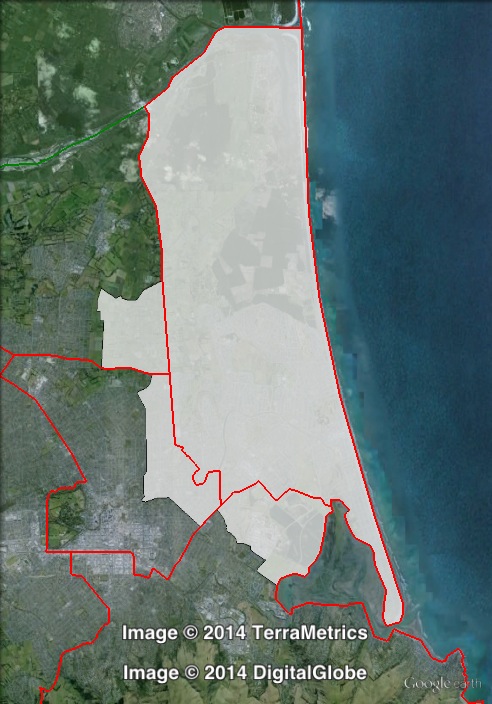
Geography
North-eastern Christchurch, including the suburbs of Aranui, Avondale, Brooklands, Burwood, Dallington, Kainga, Linwood, Marshland, New Brighton, Ouruhia, Parklands, Queenspark, Richmond, Shirley and Wainoni.
Redistribution
Christchurch East expanded outward to the west and to the south, gaining Marshland from Waimakariri, gaining Shirley and Richmond from Christchurch Central, and gaining Bromley from Port Hills. These changes reduced the Labour margin from 19% to 18.8%.
History
The electorate of Christchurch East first existed from 1871 to 1875, and then again from 1905 to 1946, and has existed in its current form since 1996. These electorates have always been Labour-held since 1922. When Christchurch East was restored in 1996, it mostly replaced Avon, which had been Labour-held since 1919.
Labour’s Larry Sutherland won Avon in 1987. Three previous Labour MPs had held Avon for 23 consecutive terms, for 68 years, from 1919 to 1987.
Sutherland was re-elected in Avon in 1990 and 1993. In 1996, Avon was abolished and Sutherland won the new seat of Christchurch East, which covered similar areas.
Larry Sutherland retired in 1999, and Labour list MP Lianne Dalziel was elected in Christchurch East.
Lianne Dalziel had held Christchurch Central from 1990 to 1996, when she was re-elected as a Labour list MP.
Lianne Dalziel served as a minister as part of the Labour-led government from 1999 to 2008, serving in a number of portfolios. Dalziel continued to serve on the Opposition frontbench for the remainder of her term in Parliament.
In 2008, Dalziel was elected to a seventh term in Parliament (and a fourth term in Christchurch East), and National candidate Aaron Gilmore was elected as a list MP.
In 2011, Dalziel was re-elected again. Gilmore narrowly missed out on re-election, with the final seat going to the Green Party after late counting. That final Green Party seat went to Mojo Mathers, who had run in Christchurch East.
In February 2013, former Speaker Lockwood Smith resigned from Parliament, and Aaron Gilmore returned to Parliament as a National list MP in Smith’s place.
Only three months later, in May, Gilmore was forced to resign from Parliament due to a scandal involving his role as a contractor to a government ministry in 2012, when he had placed pressure on a public servant in regard to his expected return to Parliament.
In October 2013, Dalziel resigned from Parliament to run for Mayor of Christchurch.
The 2013 by-election was won by Labour’s Poto Williams.
Candidates
- Leighton Baker (Conservative)
- Jo Hayes (National #47), list MP.
- Paula Lambert (Legalise Cannabis)
- Tania Mataki (Māori #21)
- Mojo Mathers (Green #9), list MP.
- Sam Park (United Future #11)
- Rob Wilkinson (Legalise Cannabis #8)
- Poto Williams (Labour #28), Member for Christchurch East.
Assessment
Christchurch East is a safe Labour seat.
2011 election results
| Electorate Votes | Party Votes | ||||||||
| Candidate | Party | Votes | % | Swing | Redist | Votes | % | Swing | Redist |
| Lianne Dalziel | Labour | 15,559 | 55.54 | +2.61 | 55.03 | 9,100 | 31.65 | -13.62 | 32.59 |
| Aaron Gilmore | National | 10,225 | 36.50 | +0.55 | 36.21 | 13,252 | 46.10 | +10.4 | 44.22 |
| Mojo Mathers | Green | 1,347 | 4.81 | -0.62 | 5.62 | 3,359 | 11.68 | +4.45 | 12.55 |
| Leighton Baker | Conservative | 522 | 1.86 | +1.86 | 1.94 | 617 | 2.15 | +2.15 | 2.09 |
| Michael Britnell | Legalise Cannabis | 254 | 0.91 | -0.32 | 0.71 | 145 | 0.50 | +0.16 | 0.55 |
| Johnny Miller | United Future | 108 | 0.39 | -0.22 | 0.30 | 160 | 0.56 | -0.39 | 0.56 |
| New Zealand First | 0.02 | 1,801 | 6.26 | +2.34 | 6.22 | ||||
| ACT | 0.07 | 101 | 0.35 | -1.58 | 0.42 | ||||
| Māori | 84 | 0.29 | -0.22 | 0.30 | |||||
| Mana | 63 | 0.22 | +0.22 | 0.27 | |||||
| Alliance | 28 | 0.10 | -0.08 | 0.11 | |||||
| Democrats | 22 | 0.08 | +0.01 | 0.06 | |||||
| Libertarianz | 17 | 0.06 | +0.02 | 0.07 | |||||
| Independent | 0.10 | ||||||||
2013 by-election results
| Candidate | Party | Votes | % | Swing |
| Poto Williams | Labour | 8,414 | 61.30 | +5.75 |
| Matthew Doocey | National | 3,577 | 26.06 | -10.44 |
| David Moorhouse | Green | 954 | 6.95 | +2.14 |
| Leighton Baker | Conservative | 494 | 3.60 | +1.74 |
| Sam Park | Independent | 78 | 0.57 | – |
| Paula Lambert | Legalise Cannabis | 59 | 0.43 | -0.48 |
| Gareth Veale | ACT | 58 | 0.42 | – |
| Adam Holland | Independent | 31 | 0.23 | – |
| Ian Gaskin | Independent | 20 | 0.15 | – |
| Jenner Lichtwark | Democrats | 20 | 0.15 | – |
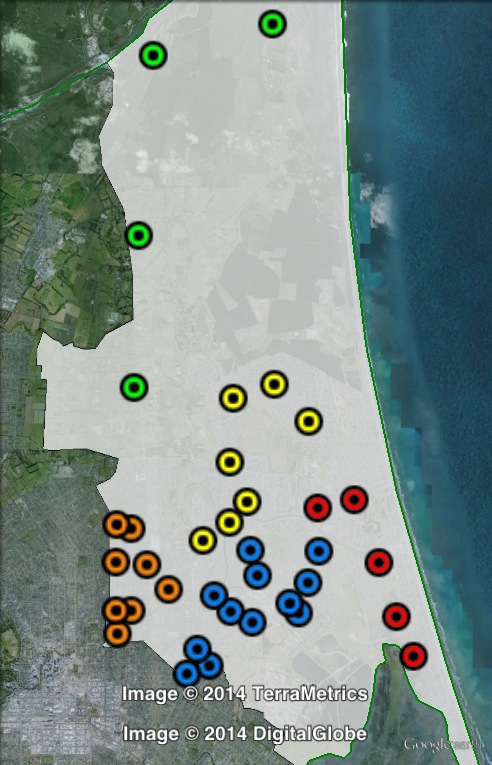
Booth breakdown
Booths in Christchurch East have been divided into five areas. Most of the electorate’s population lies in the southern half of the electorate – these areas are split into East, West, South and Central. The sparsely-populated North has also been grouped together. The new boundaries have been used to analyse the 2011 election results, but this is not possible for the 2013 by-election results. For the by-election, West and South were merged into South.
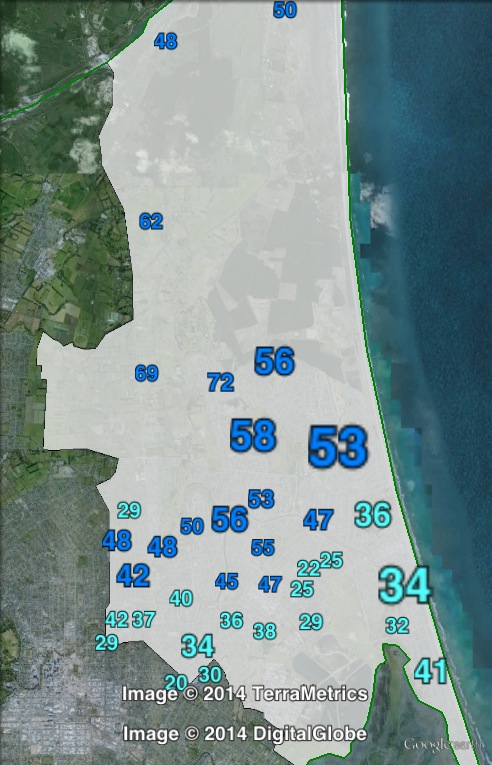
2011 election breakdown
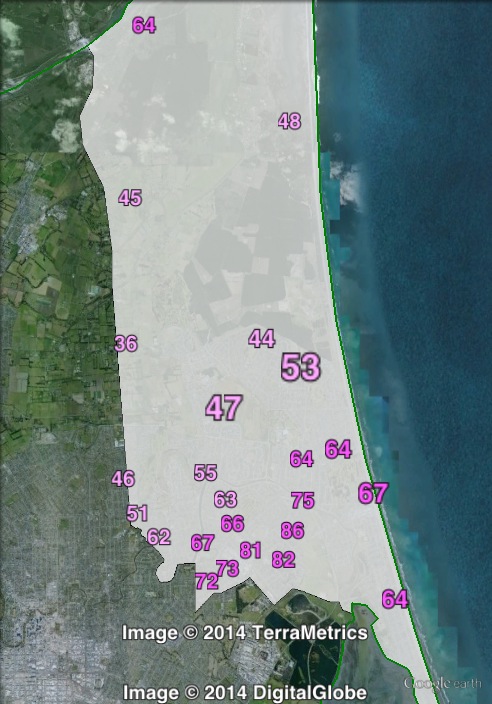
In 2011, Labour won an electorate vote majority in three out of five areas: South, West and East. In Central, National won a slight plurality, and in North, Labour won a slight plurality. The Labour vote peaked at 65.7% in the South.
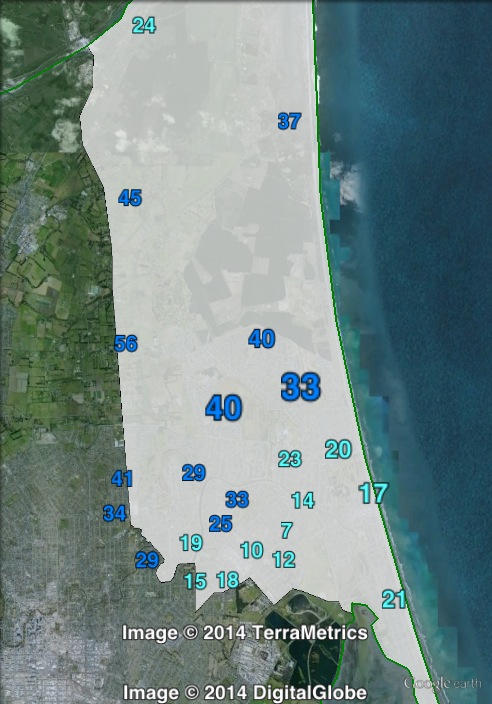
The National Party won a majority of the party vote in Central and North. Labour won a plurality of the vote in the South, while National won a plurality in the West and East.
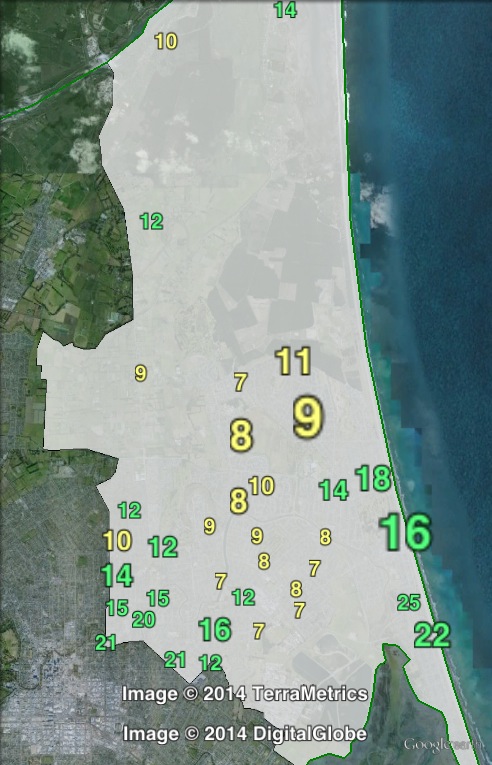
The Green Party’s party vote ranged from 9% in Central to 18.4% in the East.
| Voter group | Electorate votes | Party votes | Total | % of votes | |||||
| LAB | NAT | GRN | NAT | LAB | GRN | NZF | |||
| Central | 46.23 | 47.49 | 3.51 | 56.76 | 25.48 | 8.99 | 5.14 | 7,501 | 20.96 |
| South | 65.67 | 25.28 | 5.28 | 34.73 | 42.89 | 10.18 | 7.52 | 5,511 | 15.40 |
| West | 53.51 | 36.81 | 6.60 | 40.98 | 33.60 | 14.49 | 6.37 | 5,363 | 14.99 |
| East | 61.46 | 28.35 | 7.14 | 37.93 | 32.18 | 18.41 | 6.74 | 5,239 | 14.64 |
| North | 46.78 | 45.93 | 4.13 | 58.53 | 19.23 | 11.33 | 6.15 | 1,646 | 4.60 |
| Other votes | 54.60 | 36.00 | 6.27 | 42.89 | 33.93 | 12.63 | 6.01 | 10,519 | 29.40 |
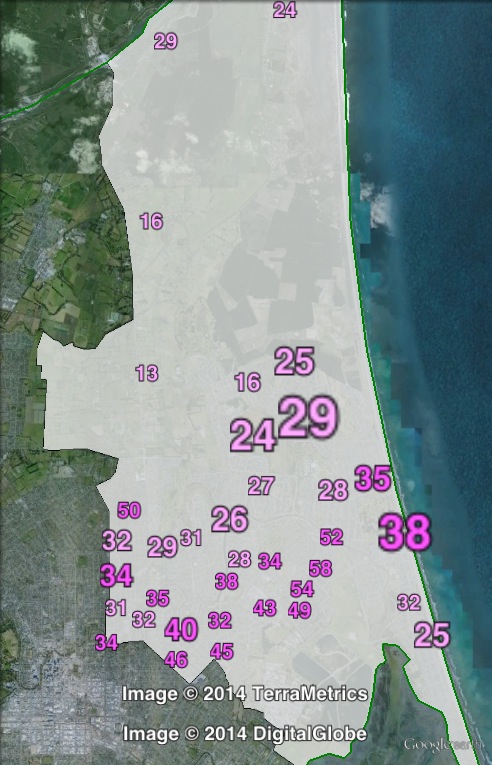
2013 by-election breakdown
The Labour Party won the by-election, with a vote that varied widely, from 45.9% in the North to 70.4% in the South. The National vote ranged from 19.9% in the East to 36.2% in the Centre.
The Green vote ranged from 4.3% in the South to 10.8% in the East.
| Voter group | LAB | NAT | GRN | CON | Total | % of votes |
| Central | 49.42 | 36.24 | 6.89 | 5.20 | 3,557 | 25.95 |
| South | 70.43 | 20.22 | 4.31 | 3.19 | 3,037 | 22.16 |
| East | 64.68 | 19.89 | 10.83 | 3.10 | 2,936 | 21.42 |
| North | 45.85 | 44.09 | 6.71 | 1.92 | 626 | 4.57 |
| Other votes | 65.68 | 22.94 | 6.14 | 3.07 | 3,549 | 25.90 |
My prediction: Labour hold.