ALP 2.0%
Incumbent MP
Patrick Conlon, since 1997.
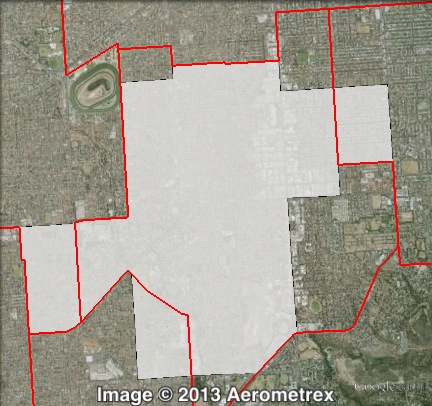
Geography
South-Western Adelaide. Elder covers the suburbs of Ascot Park, Marion, Melrose Park, Morphettville, Park Holme and Warradale.
Redistribution
Elder lost areas in the north and south, and a larger area around St Marys in the south-east. Elder gained areas from Mitchell and Morphett in the west, and some territory in the east from Waite. The ALP’s margin was cut from 3.7% to 2.0%.
History
Elder has existed since the 1993 election. The seat has been held by the ALP since 1997.
The seat was drawn as a marginal Labor seat in 1993, but was won by the Liberal Party’s David Wade. In 1997, Wade lost to the ALP’s Patrick Conlon.
Conlon became a minister in 2002 when Labor formed government, and served as a minister until he moved to the backbench in early 2013.
Candidates
Sitting Labor MP Patrick Conlon is not running for re-election. The ALP is running Annabel Digance. The Liberal Party is running Carolyn Habib. The Greens are running Paul Petherick. Dignity for Disability is running Nick Schumi. Family First is running Cosimo Russo.
- Nick Schumi (Dignity for Disability)
- Annabel Digance (Labor)
- Cosimo Russo (Family First)
- Paul Petherick (Greens)
- Carolyn Habib (Liberal)
Assessment
Elder is a very marginal Labor seat. With the sitting member retiring it will be a key target for the Liberal Party.
2010 result
| Candidate | Party | Votes | % | Swing |
| Patrick Conlon | ALP | 8,805 | 43.3 | -10.4 |
| Ben Turner | LIB | 7,691 | 37.8 | +10.4 |
| Daryl Bullen | GRN | 2,408 | 11.8 | +5.4 |
| Wendy Hay | FF | 1,003 | 4.9 | -0.5 |
| Greg Croke | DEM | 437 | 2.1 | -0.7 |
2010 two-party-preferred result
| Candidate | Party | Votes | % | Swing |
| Patrick Conlon | ALP | 10,904 | 53.6 | -12.0 |
| Ben Turner | LIB | 9,440 | 46.4 | +12.0 |
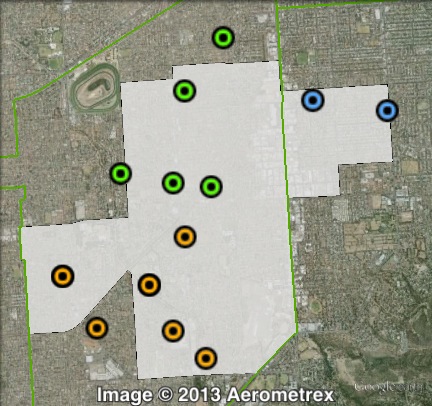
Booth breakdown
Booths have been divided into three areas: south, north-west and north-east. Most of the population lies in Mitcham local government area, and these booths were split into north-west and south. The north-east covers booths in Marion council area.
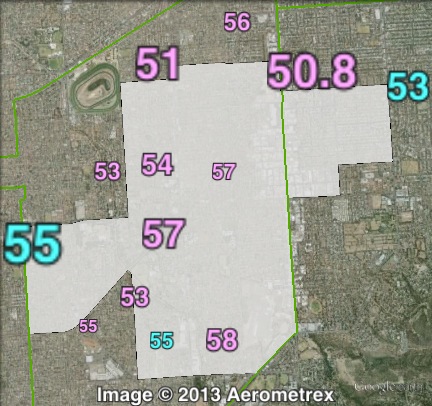
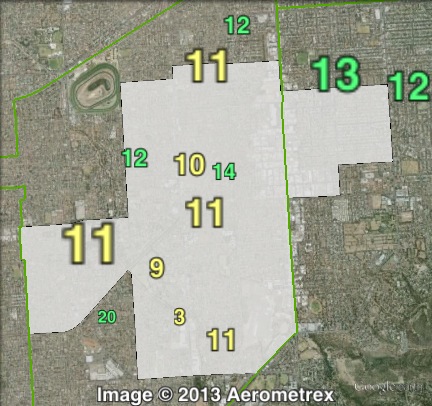
The ALP won a majority in the south and the north-west, with the Liberal Party winning 51% in the north-east, which is the smallest part of the seat. The Greens vote ranged from 9.8% in the south to 12% in the north-east.
| Voter group | GRN % | ALP 2PP % | Total votes | % of ordinary votes | |
| South | 9.78 | 51.39 | 7,206 | 43.53 | |
| North-West | 11.67 | 53.60 | 5,862 | 35.41 | |
| North-East | 12.13 | 49.00 | 3,486 | 21.06 | |
| Other votes | 12.14 | 53.20 | 4,703 |
Particularly strong Labor candidate and a big swing last time. Don’t be surprised if Labor holds against the swing here.
My prediction: Likely Liberal gain, particularly with Pat Conlon’s retirement.
Easy Liberal gain.
Prediction: LIB Gain
Especially after today’s developments.
What are today’s development?
Pollster:
http://www.adelaidenow.com.au/news/south-australia-state-election-2014/liberal-candidate-for-elder-carolyn-habib-labels-state-election-campaign-material-filthy-and-racist/story-fnl3k6uz-1226852398947
Basically, Labor have been accused of a racist smear campaign.
Thanks. Not sure there is much in this issue. Will watch this seat with more interest to see if a bigger or small than ave swing. Net result might be nil.
Sounds similar to the scandal in the western Sydney seat of Lindsay late in the 2007 election…