Incumbent Senators
| Term expires 2014 |
Term expires 2017 |
| Doug Cameron (ALP) |
John Faulkner (ALP) |
| Bob Carr (ALP)1 | Concetta Fierravanti-Wells (LIB) |
| Marise Payne (LIB) |
Bill Heffernan (LIB) |
| Arthur Sinodinos (LIB)2 | Fiona Nash (NAT) |
| Ursula Stephens (ALP) | Lee Rhiannon (GRN) |
| John Williams (NAT) |
Matt Thistlethwaite (ALP) |
1Bob Carr replaced Mark Arbib on 6 March 2012 after Senator Arbib’s resignation.
2Arthur Sinodinos replaced Helen Coonan on 13 October 2011 after Helen Coonan’s resignation.
History
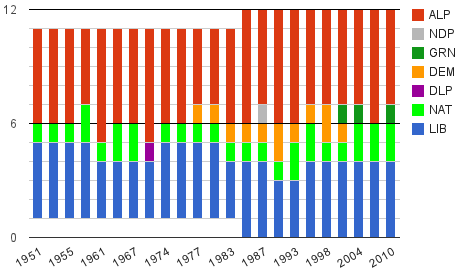
Dating back to 1951, when the Senate for the first time was entirely made up of Senators elected by proportional representation, Senate representation from New South Wales has been relatively stable. Up until 1958 the numbers remained steady with 5 ALP senators, 4 Liberal senators and 1 Country Party senator. 1958 saw the Country Party win a seat off the ALP, giving the Coalition a 6-4 majority amongst NSW senators. The ALP gained two seats in 1961, giving them a 6-4 majority. The Country Party recovered a second seat in 1964, restoring an even balance of ALP and Coalition senators. In 1970, the sitting Country Party senator was defeated, as was the Country Party senator who had filled a casual vacancy, meaning that the party lost both its seats, while the Democratic Labor Party won a NSW senate seat for the only time. The result produced a 6-4 majority for the ALP over the right-wing parties.
The 1974 double dissolution restored the 5-4-1 balance between the Labor, Liberal and Country Party, which was maintained in 1975. 1977 saw the ALP lose one of its five senate seats to the Australian Democrats. This 4-4-1-1 balance was maintained in 1980. The 1983 double dissolution saw the Liberal Party lose a seat to the ALP, seeing five ALP senators, three Liberals, and one senator each for the Democrats and National Country Party. This result produced a 6-4 majority for parties of the left for the first time 1970. The ALP and Democrats collectively maintained a majority in the NSW senate delegation for the entirety of the Labor government.
The 1984 election saw the Senate’s size increased, with New South Wales gaining an eleventh and twelfth senator. The Democrats and the National Country Party each maintained a single senator whilst the ALP gained a sixth and the Liberals a fourth. The 1987 double dissolution saw the ALP lose its sixth senator to the Nuclear Disarmament Party. The 1990 election saw the ALP and Democrats each gain a senator, at the expense of the Liberals and NDP, producing a result of 6 ALP, 3 Liberals, 2 Democrats, 1 National. This gave the ALP and Democrats an 8-4 majority. In 1993 the Democrats lost a seat, with the Nationals gaining a second senator in NSW for the first time since 1970.
In 1996, the ALP lost a senate seat to the Liberals, producing an even split between the ALP and Democrats and the Coalition. The left gained a majority again, however, in 1998, when the Nationals lost a senator to the Democrats. In 2001, Democrat Vickie Bourne was defeated by Greens candidate Kerry Nettle, maintaining a 7-5 left-right split.
The last Democrat, Aden Ridgeway, was defeated in 2004, replaced by Nationals candidate Fiona Nash, restoring a 6-6 split between the ALP and Greens and the Coalition. The 2007 election saw the ALP win a sixth senate seat at the expense of the Greens. This was the first election since 1975 to result with NSW having no minor party senators, with a 6-6 split between the ALP and the Coalition.
In 2010, the Greens won back a single Greens seat, with former state MP Lee Rhiannon moving to the Senate. The ALP lost one of their three seats to the Greens, while the Liberal Party maintained their three seats.
Since the 2010 election, Mark Arbib was replaced by former Premier Bob Carr in 2012. Helen Coonan was replaced in 2011 by Arthur Sinodinos.
2010 result
| Group | Votes | % | Swing | Quota |
| Liberal/Nationals | 1,617,418 | 38.95 | -0.38 | 2.7265 |
| Labor | 1,517,382 | 36.54 | -5.53 | 2.5579 |
| The Greens | 443,913 | 10.69 | +2.26 | 0.7483 |
| Shooters and Fishers | 96,638 | 2.33 | +2.33 | 0.1629 |
| Liberal Democrats | 95,752 | 2.31 | +2.12 | 0.1614 |
| Christian Democratic Party | 80,376 | 1.94 | -0.03 | 0.1355 |
| Australian Sex Party | 73,553 | 1.77 | +1.77 | 0.1240 |
| Family First | 39,123 | 0.94 | +0.34 | 0.0660 |
| Democratic Labor Party | 30,939 | 0.75 | -0.51 | 0.0522 |
| Australian Democrats | 28,398 | 0.68 | -0.21 | 0.0479 |
| One Nation | 23,456 | 0.56 | +0.15 | 0.0395 |
| Socialist Alliance | 23,392 | 0.56 | +0.48 | 0.0394 |
| Others | 82,184 | 1.99 | 0.1385 |
The ALP and the Coalition each won two seats on first preferences.
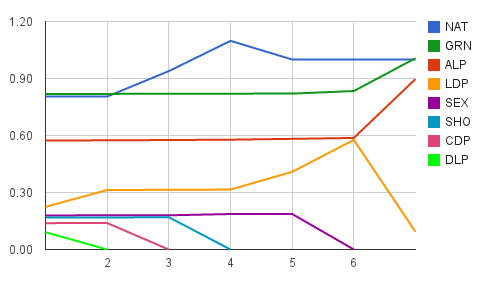
After the elimination of most candidates, the final six candidates standing were:
- Fiona Nash (NAT) – 0.9388 quotas
- Lee Rhiannon (GRN) – 0.8198
- Steve Hutchins (ALP) – 0.5762
- Glenn Druery (LDP) – 0.3143
- Marianne Leishman (SXP) – 0.1800
- Jim Muirhead (SHO) – 0.1698
Preferences from the Shooters Party mostly flowed to the Coalition, electing Nash.
- Nash (NAT) – 1.0981
- Rhiannon (GRN) – 0.8203
- Hutchins (ALP) – 0.5779
- Druery (LDP) – 0.3154
- Leishman (SXP) – 0.1867
Nash’s preferences mostly flowed to Druery.
- Rhiannon (GRN) – 0.8340
- Hutchins (ALP) – 0.5871
- Druery (LDP) – 0.5767
The elimination of Druery saw a majority of his preferences flow to the Labor candidate, but enough votes flowed to the Greens to elect Lee Rhiannon. The final .09 of a quota was left undistributed.
- Rhiannon (GRN) – 1.0065
- Hutchins (ALP) – 0.8972
- Druery (LDP) – 0.0936
Candidates
The ALP is running:
The Coalition is running:
- Marise Payne (LIB)
- John Williams (NAT)
- Arthur Sinodinos (LIB)
The Greens are running sitting state MP Cate Faehrmann. The DLP are running Simon McCaffrey. The Pirate Party are running Brendan Molloy. Patricia Petersen’s Australian Independents party is running Bradley Tanks. The Katter’s Australian Party is running Peter Mailler. The Christian Democratic Party is running Robyn Peebles. Family First are running Fiona Rossiter. The Stable Population Party is running William Bourke. The Palmer United Party is running Matt Adamson. The 21st Century Australia Party is running Cameron Curtis. The Animal Justice Party is running Mark Pearson. The Socialist Equality Party is running Nick Beams. The Secular Party is running Ian Bryce. The Wikileaks Party is running Kellie Tranter.
Assessment
The Greens did not win in 2010 with much of a buffer. If you assume that all of the remaining LDP preferences flowed to Hutchins, the margin was only .015 quotas, or a gap of less than 10,000 votes. If you assume all of Druery’s preferences remaining flow to the Greens (which is less likely) the gap is 120,000 votes, or just over one-tenth of a quota.
This, however, is an academic discussion, because there seems to be very little chance of Labor increasing their vote in 2013 sufficient to regain their third Senate seat.
The other possible change could come if the Coalition or another conservative candidate was to win a fourth right seat at the expense of one of the Labor senators. If you add the final count for the LDP to the three quotas for the electing Coalition candidates, and add the final count at the same point for the Greens and Labor to the quotas for the two elected Labor candidates, you get the following figures:
- Left – 3.4211 quotas
- Right – 3.5767 quotas
If you assume no major shifts in preference allocation, it would require a swing of about 0.43 of a quota from Labor, the Greens and other left parties to the Coalition and other right parties to give the seat to a conservative candidate.
This swing is just over 6% of the vote, and equates to a shift in about 250,000 votes on the 2010 figures.
This could take place through a swing in votes from the ALP and Greens to the Liberal Party, but could also take place if parties decide to change their preferences. If a new party such as the Wikileaks Party takes voters from the centre-left bloc but gives its preferences to a party outside that ALP and the Greens, that would equate to a swing.
There is another possibility which could see the left bloc reduced to two seats without a swing to the right equivalent to 6.2%. In 2010 the ALP came close to being overtaken by Glenn Druery at the key point. If Labor’s third candidate was knocked out, and their preferences were to flow to a minor right-wing candidate ahead of the Greens, it could see the right win four out of six seats. This is the scenario that saw Steve Fielding of Family First elected in 2004. This scenario will be prevented if the Greens manage to gain direct preferences from Labor ahead of all other groups.
I think there is a real case for a 4/2 right/left result in NSW.
Glen – if a party doesn’t submit its preference ticket on time, they don’t get a box above the line and voters can’t vote above the line for that party.
This time around it happened in Vic, but not NSW. If you look at the Vic senate ballot (http://www.aec.gov.au/election/vic/files/vic-gvt.pdf), the above the line box is missing for a number of groups, including Group B Liberal Democrats and Group C One Nation.
If they didn’t lodge a group voting ticket then they will not have a box above-the-line, so voters wanting to vote for them must vote below-the-line. With 110 boxes to number, not many voters are likely to take this option up, so you can consider them irrelevant to the result.
DB, what minor right party do you reckon will get up?
The Senate race seems very fragmented. With that said, it is rare that a micro party wins a Senate seat. It happened in 2004 due to the ALP doing a preference deal with the FFP, and this time the Greens are getting full preferences from the ALP. It happened in 2010 due to a low Coalition primary vote and very generous preferences. I suppose if we get a 55/45 sort of result it could happen to someone like the Shooters & Fishers (One Nation won’t get any Liberal surplus, so….), but I don’t think Labor do that badly.
Edward – ah, sorry, I was looking at the Senate election calculator, and forgot that I’d switched it to Victoria. My mistake. Thanks for the info, anyway.
If you assume that the senate numbers will be similar to the state breakdown that Morgan poll provides here, you see a 3/3 result. I got One nation, labor and the greens in the final count, although this is unlikely, it does suggest that the greens really need to campaign hard to secure that senate spot
Link to the 1999 NSW upper house results for a reference to how micro candidates might do when this many parties run:
http://www.elections.nsw.gov.au/results/state_elections_-_legislative_council/1999/1999_lc_group_totals
The median result was about 0.2%. In total 11 parties surpassed the 1% mark. Not very many parties scored between 1% and 0.3%.The Marijuana Smokers Rights Party got 1.2%.
A must watch! Antony Green suggesting that if people can find Hanson on the ballot paper and she gets over 2% she could well be elected. And possibly at the expense of Sinodinos,
Green also not mincing words about the numerous minor parties in this election undermining the integrity of the electoral system,
http://www.abc.net.au/news/2013-08-29/preference-deals-could-benefit-micro-parties-at/4920822
And this long well written article by Green just came online, http://www.abc.net.au/news/2013-08-29/green-senate-ballot-system-threatens-more-than-our-eyesight/4921966
“Newspoll today brings a poll from a sample of 800 respondents from the five most marginal Labor electorates in Sydney – Greenway (0.9%), Lindsay (1.1%), Banks (1.5%), Reid (2.7%) and Parramatta (4.4%) – which suggests the whole lot will be swept away, and perhaps others besides. Labor’s collective two-party preferred vote across the five seats is put at 43%, which compares with 52.1% at the 2010 election. The primary vote has Labor down from 43.2% to 34%, the Liberals up from 42.8% to 52%, the Greens down from 7.9% to 7% and “others” up from 6.1% to 7%. On two party preferred, Labor is down from 52.1% to 43%”.
Source: Pollbludger
Very different from the Galaxy Poll covering a similar area last week – Kevin Bonham is of the view that one of them is wrong and his money is on Galaxy
I thought he said Newspoll was the one that he thinks was wrong?
Galaxy’s figures looked the most believable IMO.
Queensland observer
Posted August 25, 2013 at 3:02 AM
I wouldn’t discount the Ldp here. Preference flow seems good to them.
It wasn’t the preference flow that enabled this result, QO, it was their unusually high primary vote (more than half of their final quota by the time they win the seat comes from their primary). Speculation is that it occurred due to people mistaking them for the Liberals on the ballot, although I’m not sure how true that is – are that many people really so easily confused?
I am still claiming I called them for a seat!
Glen, unfortunately lots of voters are readily confused – both in terms of how to vote and who to vote for. Site master Ben Raue once wrote that voters’ confusion in relation to just voting “1” above the line or below the line might’ve cost Pauline Hanson a seat in the NSW Upper House at the 2011 state election – he wrote that they voted “1” in the wrong place and their votes had to be counted as invalid. The LDP might well have been lucky in this instance, but I don’t remember any previous instances of a less-powerful minor party winning a seat in the Senate (or the Upper House of one of the state parliaments) simply by virtue of being in Column A on the ballot paper.
I suspect that Hanson will keep contesting elections until she wins a seat again – she just never knows when to quit.