 The Electoral Commission of Queensland on Friday released its draft boundaries for the 26 wards covering the City of Brisbane – Australia’s biggest local council.
The process is similar to processes followed for state, territory and federal electoral redistributions, a number of which are currently taking place. In December, I posted about the prospects for the redistribution.
Despite the twelve northern wards being substantially larger than the fourteen wards south of the Brisbane river, the ECQ has chosen to not draw a ward crossing the river, thus leaving the north with twelve wards, all slightly larger than the fourteen on the south side.
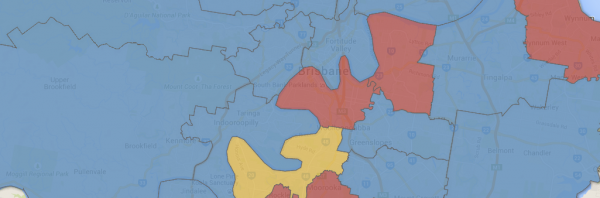
In this blog post, I will describe what changes have taken place, and what they mean for the electoral landscape of Brisbane. I’ve also included an interactive map of the new boundaries.
You can now download the draft boundary map here. In the next few months I will also prepare updated maps for all the other councils in Queensland undergoing ward redistributions, as well as those in three other states.
You can use the above map to click on each ward, and you’ll see the estimated two-party-preferred figures on both the mayoral vote and the council vote, as well as the council vote margin for the equivalent ward in 2012.
There are three wards where the ALP and LNP were not the final two candidates in 2012. In Tennyson, where an independent holds the ward, I estimated a two-party-preferred figure based on comparing the Tennyson mayoral vote to other wards. In Pullenvale and Walter Taylor, where the Greens outpolled Labor, two-party-preferred counts exist for booth results, so an estimate was made for special votes.
As I foreshadowed in December, there is about one-quarter of a ward’s surplus population north of the river, but this wasn’t enough for the ECQ to cross the river boundary. This has had consequences for the population balance. Only two out of twelve northern wards are under the average population, while only two out of fourteen southern wards are above the average.
Six wards were renamed: one in the north and five in the south. In practice, it can be argued that the name of Holland Park has been applied to an entirely new ward, which predominantly takes in parts of other wards.
The changes were much less dramatic on the north side. Six seats in north-eastern Brisbane underwent little to no changes, and there were no major knock-on effects.
There were reasonably significant changes to the northern boundaries of Central ward, with knock-on effects to wards to the west. Enoggera and the Gap moved east, as did Pullenvale and Walter Taylor. Toowong moved far enough east to lose the suburb of Toowong, and thus has been renamed ‘Paddington’.
On the south side, the changes were more dramatic, with a string of seven wards completely redrawn.
While there were significant changes to their borders, the wards of Tennyson, The Gabba, Morningside, Doboy and Wynnum-Manly have been left largely intact. All five of these wards lie alongside the river. You could also argue that Chandler, on the south-eastern edge of Brisbane, has been left largely intact.
The ward of Jamberoo, at the western end of the river’s south bank, has maintained most of its territory but gained more areas in the south-west. Between Jamberoo and Chandler, seven other wards have been significantly redrawn.
Moorooka, in the middle of this block of seven seats, has maintained its name while undergoing major changes.
There is still a ward named ‘Holland Park’, but the existing Holland Park ward has undergone drastic changes. From my examinations, I believe Coorparoo is more of a successor to the existing Holland Park, while the new Holland Park takes in more of Wishart.
The other wards of Karawatha, Parkinson, Macgregor and Richlands have all been abolished and been replaced by Runcorn, Calamvale, Garden City and Forest Lake. I believe the best matches for the old and new wards are in the order I listed them above, but they are a very rough match.
So what does this mean for the pendulum?
At the moment, Labor is a long way away from disrupting the LNP’s majority. The ALP holds seven wards to the LNP’s 18, along with one independent. Assuming that the independent maintains their hold on Tennyson, Labor would need to win another five seats to deprive the LNP of a majority, or seven to win a majority in their own right.
On the old boundaries, a uniform swing of 15.6% would produce a hung council, with a swing of 16.9% giving Labor a majority. Those numbers are now 14.2% and 17.3%.
So overall, Labor’s task in winning control of the council remains huge. In terms of marginal wards, Labor’s position has been improved in Doboy, the most marginal LNP ward. The margin there has been cut from 4.6% to 1.8%. After this, however, there are no more opportunities for Labor to gain wards until they gain a swing of 9.4%.
| Ward | Old council | New council | Old mayoral | New mayoral |
| Bracken Ridge | LNP 21.6% | LNP 21.8% | LNP 20.8% | LNP 21.1% |
| Parkinson/Calamvale | LNP 17.1% | LNP 18.1% | LNP 21.5% | LNP 23.0% |
| Central | LNP 8.7% | LNP 9.4% | LNP 16.7% | LNP 16.9% |
| Chandler | LNP 26.8% | LNP 25.4% | LNP 27.8% | LNP 27.9% |
| Holland Park/Coorparoo | LNP 11.1% | LNP 13.6% | LNP 16.2% | LNP 18.1% |
| Deagon | ALP 5.6% | ALP 5.9% | LNP 8.7% | LNP 8.9% |
| Doboy | LNP 4.6% | LNP 1.8% | LNP 13.2% | LNP 10.6% |
| Enoggera | LNP 15.6% | LNP 14.2% | LNP 17.4% | LNP 17.3% |
| Richlands/Forest Lake | ALP 17.7% | ALP 3.9% | ALP 1.7% | LNP 5.9% |
| Macgregor/Garden City | LNP 24.6% | LNP 24.5% | LNP 28.5% | LNP 27.6% |
| Hamilton | LNP 24.4% | LNP 24.6% | LNP 26.7% | LNP 26.9% |
| Wishart/Holland Park | LNP 21.4% | LNP 11.3% | LNP 22.8% | LNP 17.9% |
| Jamboree | LNP 26.8% | LNP 18.7% | LNP 27.6% | LNP 22.7% |
| Marchant | LNP 16.9% | LNP 16.6% | LNP 17.9% | LNP 17.6% |
| McDowall | LNP 23.4% | LNP 23.4% | LNP 26.8% | LNP 26.7% |
| Moorooka | ALP 9.0% | ALP 9.9% | LNP 8.5% | LNP 7.3% |
| Morningside | ALP 6.0% | ALP 6.0% | LNP 10.7% | LNP 10.7% |
| Northgate | ALP 0.4% | ALP 0.4% | LNP 11.5% | LNP 11.5% |
| Toowong/Paddington | LNP 12.4% | LNP 17.5% | LNP 18.9% | LNP 18.3% |
| Pullenvale | LNP 32.8% | LNP 31.8% | LNP 32.4% | LNP 32.4% |
| Karawatha/Runcorn | LNP 16.3% | LNP 17.3% | LNP 22.7% | LNP 23.5% |
| Tennyson | IND | IND 7.3% | LNP 17.4% | LNP 18.4% |
| The Gabba | ALP 8.0% | ALP 8.3% | LNP 6.2% | LNP 6.1% |
| The Gap | LNP 21.5% | LNP 21.1% | LNP 22.4% | LNP 22.3% |
| Walter Taylor | LNP 25.6% | LNP 22.5% | LNP 27.1% | LNP 25.7% |
| Wynnum Manly | ALP 1.2% | ALP 0.6% | LNP 10.3% | LNP 10.6% |

Thanks so much for putting this together!
While overall the redistribution favours the LNP, Labor must consider itself a chance in Doboy and Holland Park. The Gap is a smoky as well with a very popular Councillor retiring and the new Ward taking in all of the areas affected by an unpopular Newman proposal to develop Upper Kedron.
How did you work out these figures Ben? Are they based on 2012 election results solely and what assumptions did you make?
I used the 2012 election results, and transferred booths based on the redistribution changes.
This is a pretty sensible redrawing of the wards. The best proposal for crossing the river involved Fig Tree Pocket being added to the Jamboree Ward, which wasn’t very satisfactory.
I live in the midst of the wholesale changes on the southside, and there’s some very odd map-drawing which I think one or both major parties might well object to. Including Ellen Grove with suburbs like Mt Ommaney in Jamboree (not “Jamberoo”) is weird in terms of the ECQs stated ideal of keeping communities of interest together. Similarly, Moorooka is now named after the suburb to its extreme north, and stretches to Pallara and Willawong.
I think the ALP is making the best of a bad situation. Yes, there may be a minor scuffle in the LNP on the southside, but the ALP need to change the vote of about 20% of Brisbanites to sin. Won’t be easy!kmkk
Hi Ben! Have you seen the final boundaries? I’d be interested to see what the new margin is in Doboy
Hi Paul,
I just finished doing my estimates this morning – I didn’t make any changes to the margins since no booths were transferred. I’ll be posting the updated map tomorrow.
Ben
Comments are closed.