| Electorate | Margin | Electorate | Margin |
| Hutt South | LAB 9.91% vs NAT | Rimutaka | LAB 15.07% vs NAT |
| Mana | LAB 6.64% vs NAT | Rongotai | LAB 25.14% vs NAT |
| Ōhariu | UNF 0.29% vs LAB | Wellington Central | LAB 17.4% vs NAT |
 Local electorates
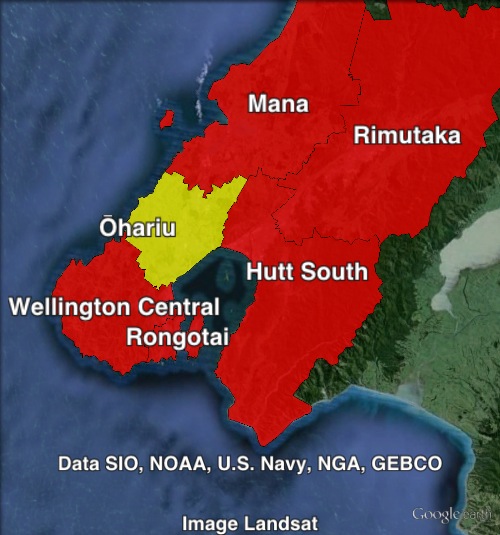
There are six electorates in the Wellington urban areas. Five of these seats are held by Labour, and the sixth is held by United Future.
United Future’s sole MP Peter Dunne holds the electorate of Ōhariu by a very slim 0.3% margin over the Labour Party.
The five Labour seats range in margin from 6.6% to 25.1%.
The electorates of Mana and Hutt South are both reasonably marginal, and Hutt South in particular has been targeted by the National Party.
Rimutaka, in the Upper Hutt Valley, is a reasonably safe Labour seat with a 15.1% margin.
The inner-Wellington electorates of Rongotai and Wellington Central are held by solid margins of 25.1% and 17.4% respectively. Those two seats the strongest Green electorates in the country, with a party vote of 24% and 27% respectively. In Wellington Central, the Labour Party won the electorate vote easily, but came third on the party vote.
Redistribution
Relatively minor changes. No changes were made to Mana and Rongotai.
Assessment
Wellington is a strong area for the Labour Party, and a weak area for the National Party. It is also the best area in the country for the Green Party. Despite this trend, the National Party still topped the party vote in the area, thanks to the centre-left vote being split between Labour and Green.
Labour outpolled their nationwide electorate vote by 12%, and their nationwide party vote by 4.6%. The Labour electorate vote is higher in Wellington than in area.
National polled 15% less of the electorate vote than they did nationally (32% vs 47%). National did substantially better on the party vote, winning 41% (compared to 47% nationally). This was in part due to National voters casting a tactical voting for Peter Dunne in Ōhariu. United Future polled almost 7% of the electorate vote, but only 0.9% of the party vote.
The Green Party polled a huge 17.2% of the party vote in the Wellington region, compared to 11.1% across New Zealand. This included two big results in Rongotai and Wellington Central.
2011 election results
| Electorate Votes | Party Votes | |||||||
| Party | Votes | % | Swing | Redist | Votes | % | Swing | Redist |
| National | 67,480 | 32.07 | -1.47 | 32.07 | 88,688 | 41.11 | +3.11 | 41.11 |
| Labour | 99,302 | 47.19 | +3.03 | 47.19 | 69,226 | 32.09 | -7.48 | 32.09 |
| Green | 22,982 | 10.92 | +1.2 | 10.92 | 37,036 | 17.17 | +5.41 | 17.17 |
| New Zealand First | 1,106 | 0.53 | -1.88 | 0.53 | 10,039 | 4.65 | +1.92 | 4.65 |
| Conservative | 2,064 | 0.98 | +0.98 | 0.98 | 3,541 | 1.64 | +1.64 | 1.64 |
| United Future | 14,699 | 6.98 | +0.32 | 6.98 | 2,013 | 0.93 | -0.43 | 0.93 |
| ACT New Zealand | 1,175 | 0.56 | -1.08 | 0.56 | 1,633 | 0.76 | -2.11 | 0.76 |
| Māori | 168 | 0.08 | +0.08 | 0.08 | 1,343 | 0.62 | -0.23 | 0.62 |
| Legalise Cannabis | 736 | 0.35 | +0.01 | 0.35 | 977 | 0.45 | +0.11 | 0.45 |
| Mana | 889 | 0.41 | +0.41 | 0.41 | ||||
| Libertarianz | 178 | 0.08 | -0.07 | 0.08 | 189 | 0.09 | +0.01 | 0.09 |
| Alliance | 52 | 0.02 | -0.04 | 0.02 | 107 | 0.05 | -0.04 | 0.05 |
| Democrats | 70 | 0.03 | +0.02 | 0.03 | ||||
| Others | 505 | 0.24 | -1.08 | 0.24 | ||||
