Last Thursday, the Victorian Electoral Boundaries Commission released the draft boundaries for the Victorian state redistribution. These boundaries are expected to cover the 2014 and 2018 state elections.
Antony Green has produced his estimates of the margins for all eighty-eight electorates.
In short, two Nationals and one Liberal seat were abolished. A new Liberal seat and two new Labor seats were created. Four other marginal Labor seats have flipped to be notionally Liberal or National.
On paper, the Nationals have lost one seat and Labor have lost two, with the Liberal Party gaining three. However the swing for Labor to win government has been reduced. On current boundaries, the ALP needs to win two seats with a swing of 1.2% to form a majority government. On new boundaries, the ALP will need to win four seats, but only need a 0.4% swing.
New South Wales is also in the process of redrawing its boundaries.
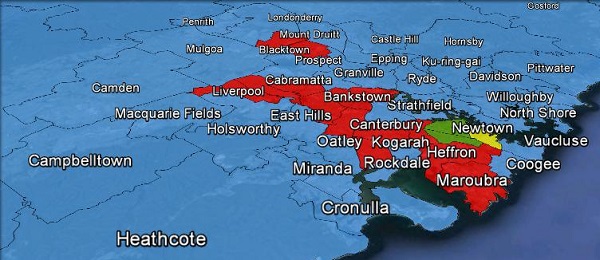
Two weeks after draft boundaries were released for the New South Wales state redistribution, I have finally completed the Google Earth map of the state.
You can download the map here.
I’ve previously blogged about this redistribution, and Antony Green has already posted a similar analysis to the one he did for Victoria. In addition, he has released a more detailed research paper with estimates for margins and primary votes for all 93 electorates.
I have also done one extra bit of analysis, looking at which parts of the state have been drawn under- or over-quota.
The Commissioners were required to fit electorates to two quotas: within 10% of the average for the number of voters as of February 2013, and the estimated number of voters as of April 2015.
| Region | 2013 quotas | 2015 quotas |
| Central Sydney | 10.8169 | 10.8921 |
| Hunter & Central Coast | 14.0397 | 13.9789 |
| Northern NSW | 6.9952 | 6.9832 |
| Northern Sydney | 11.0712 | 11.0423 |
| South-East NSW | 9.1528 | 9.1280 |
| Southern Sydney | 5.1172 | 5.0696 |
| South-West Sydney | 10.8176 | 10.8978 |
| Western NSW | 10.2230 | 10.1182 |
| Western Sydney | 14.7664 | 14.8897 |
The Commissioners have clearly chosen to draw seats larger than the average in regions with a declining population (Northern Sydney, South-East NSW, Southern Sydney, Western NSW), and draw smaller seats in regions with a growing population (Central Sydney, South-West Sydney, Western Sydney). The Hunter, Central Coast and the north of the state have been drawn very close to the quota.
These numbers reflect the approach of the ALP, rather than the Nationals who advocated using the loose quota rules to draw less-populated electorates in regional areas. The Liberal Party and the Greens proposed boundaries that stuck very closely to the quota.
The Commissioners only drew three districts that diverge from the 2015 quota by more than 3.5%, and thus would have been prohibited under the previous rules. One of these seats is the far-western Barwon, that is declining in population rather quickly. The other two are Shellharbour and Wollongong in the Illawarra region. Both are also declining, and have been drawn to be above the quota.
UPDATE: Edward Boyce in comments has pointed out an error. In addition to the three seats that have been drawn more than 3.5% over the quota, the Western Sydney seats of Camden and Riverstone, which are both growing very fast, have been drawn more than 3.5% under quota.
UPDATE 2: My error: the former threshold was 3%, not 3.5%, and eleven electorates vary by more than 3%.

Antony never calculated a margin for newtown but listed it as GRN, do we know what that margin is or is it simply too hard to measure?
You could make a guess but it would be less reliable than others – the electorate includes parts of Sydney (IND vs LIB) and Heffron (ALP vs LIB) so you don’t have a margin in those areas. You also have votes for Clover Moore that presumably will go to another candidate, but we don’t know how they break.
If you took the LC figures for the booths from the seat of Sydney, and then applied the ALP vs GRN preference flow from Balmain and Marrickville then you could come up with a figure for the eastern end of the electorate, but it’d be much more speculative than in other seats.
I have a minor quibble with the last paragraph. 3 districts exceed the 2015 quota by more than 3.5%, as you’ve identified, but there are also 2 seats which fall short of the 2015 quota by more than 3.5%. These are Camden and Riverstone, both of which are growing more rapidly than the state as a whole.
Thanks Edward, you’re correct.
The final boundaries have been released, with only minor changes to the draft boundaries.
Comments are closed.